In this article:
- Overview of Analytics
- Viewing Analytics
- Usage
- Recognition
- Feedback
- 1-on-1s
- Surveys & Pulses
- Talent Reviews
- Succession Planning
Overview of Analytics
As an admin user of Quantum Workplace, you have access to the aggregate data for each Quantum Workplace feature your organization uses via Analytics.
Managers in your organization have access to an Analytics section that provides usage data for their downline and aggregate data for Survey, 1-on-1 and Feedback cycles, when Manager Analytics are enabled.
Viewing Analytics
In the left-hand navigation menu, admins have an Analytics section with a drop-down for each feature the organization has access to, i.e. Feedback, 1-on-1s, Surveys, etc.
Admins can also view the analytics by clicking the feature in the left-hand navigation menu.
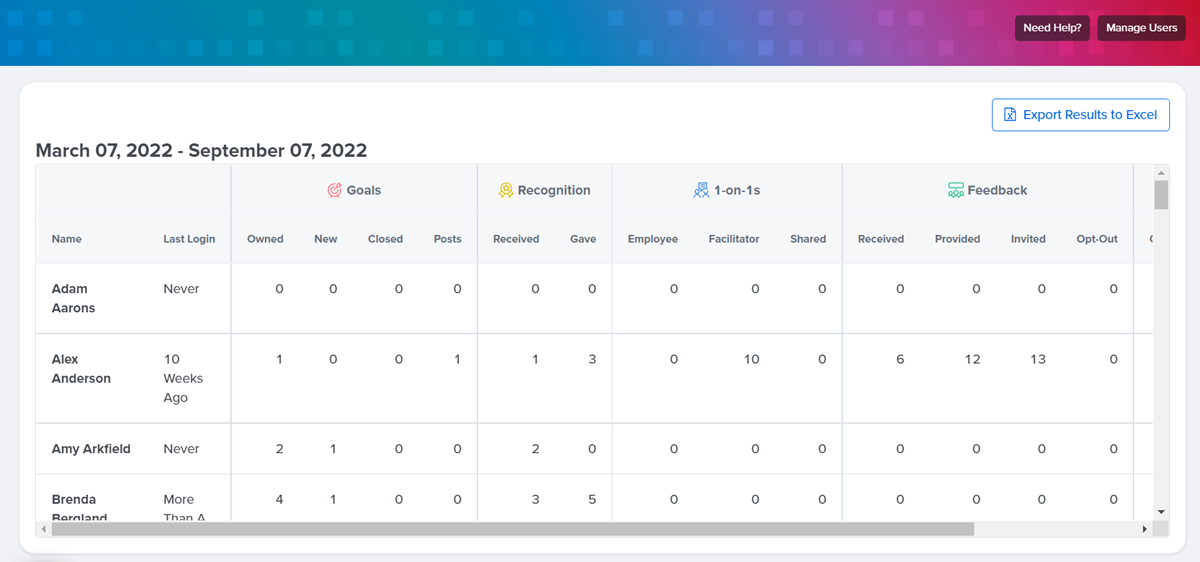
Usage
View and export how frequently your employees are using each aspect of Quantum Workplace as well as the date of each employee's last login.
You can view this usage data either in-app or click Export Results to Excel.
Recognition
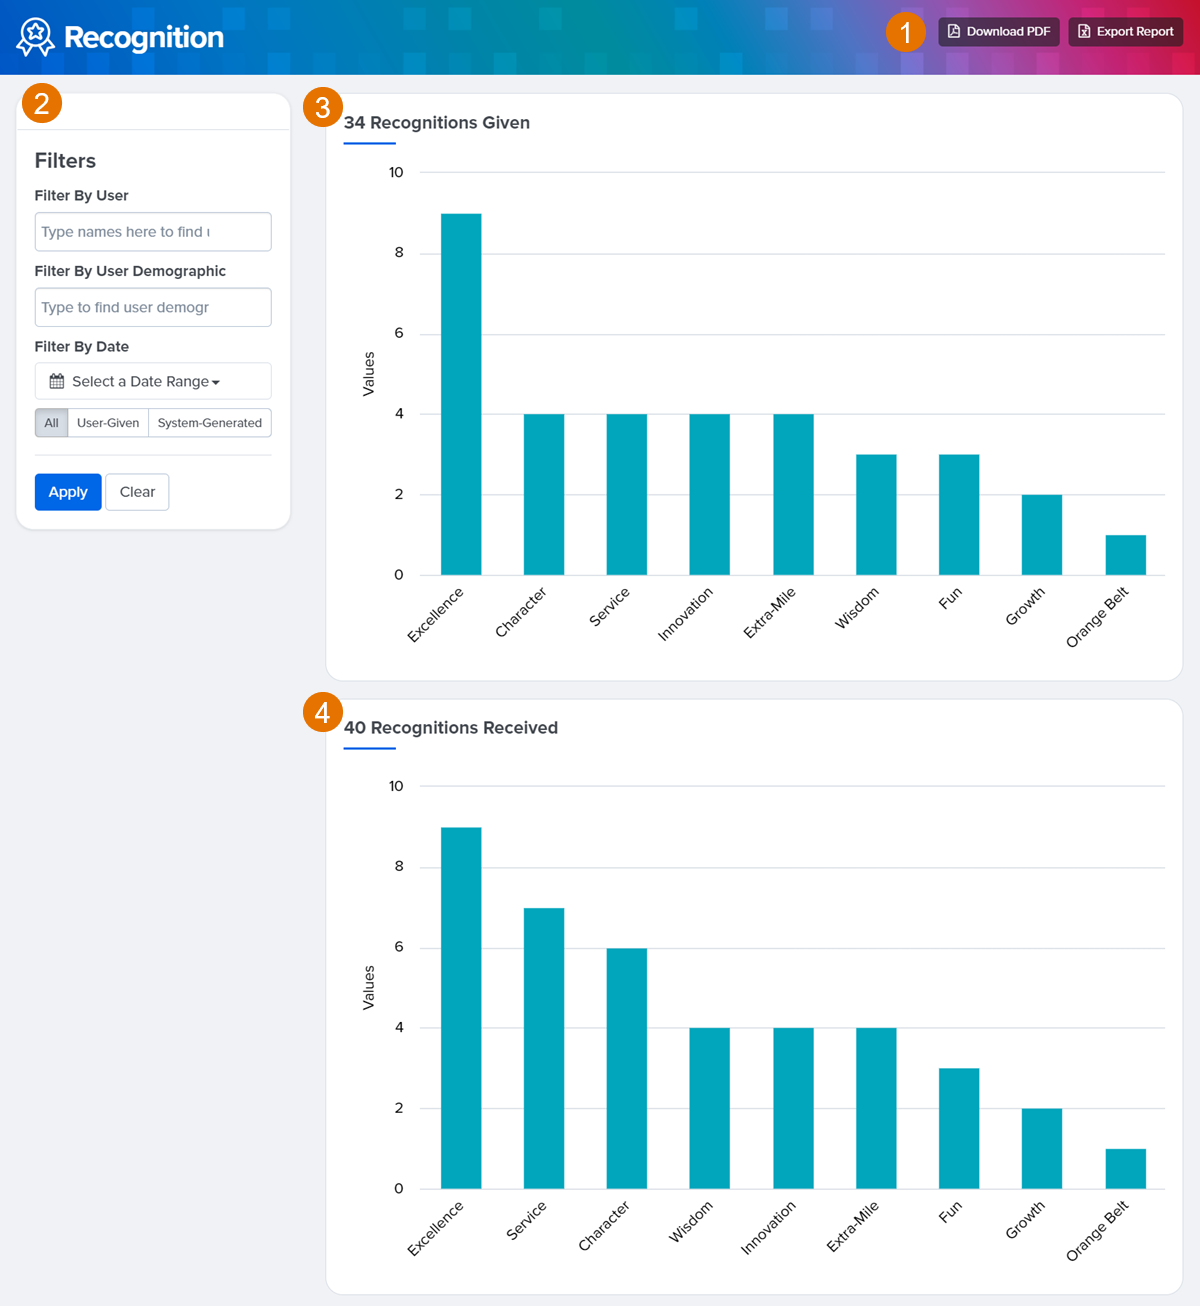
- Download PDF and Excel Report to download the data to your device, active filters will be reflected in the PDF and Excel
- Filter Recognition data by User, Demographic, Date and whether it was user-generated or system-generated
- Recognitions Given displays the number of times Recognition was given with each badge
- Recognitions Received displays the number of times Recognition was received with each badge
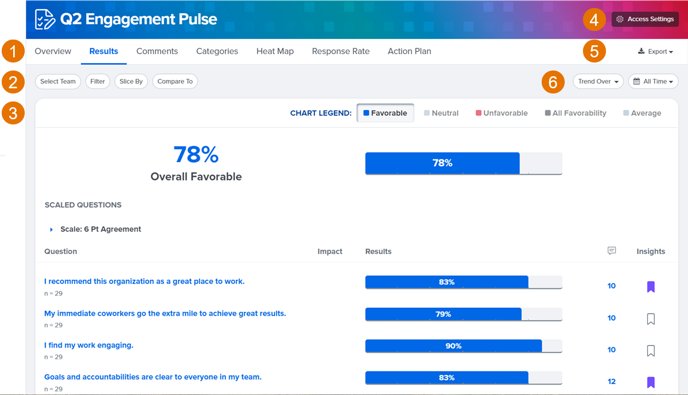
Feedback
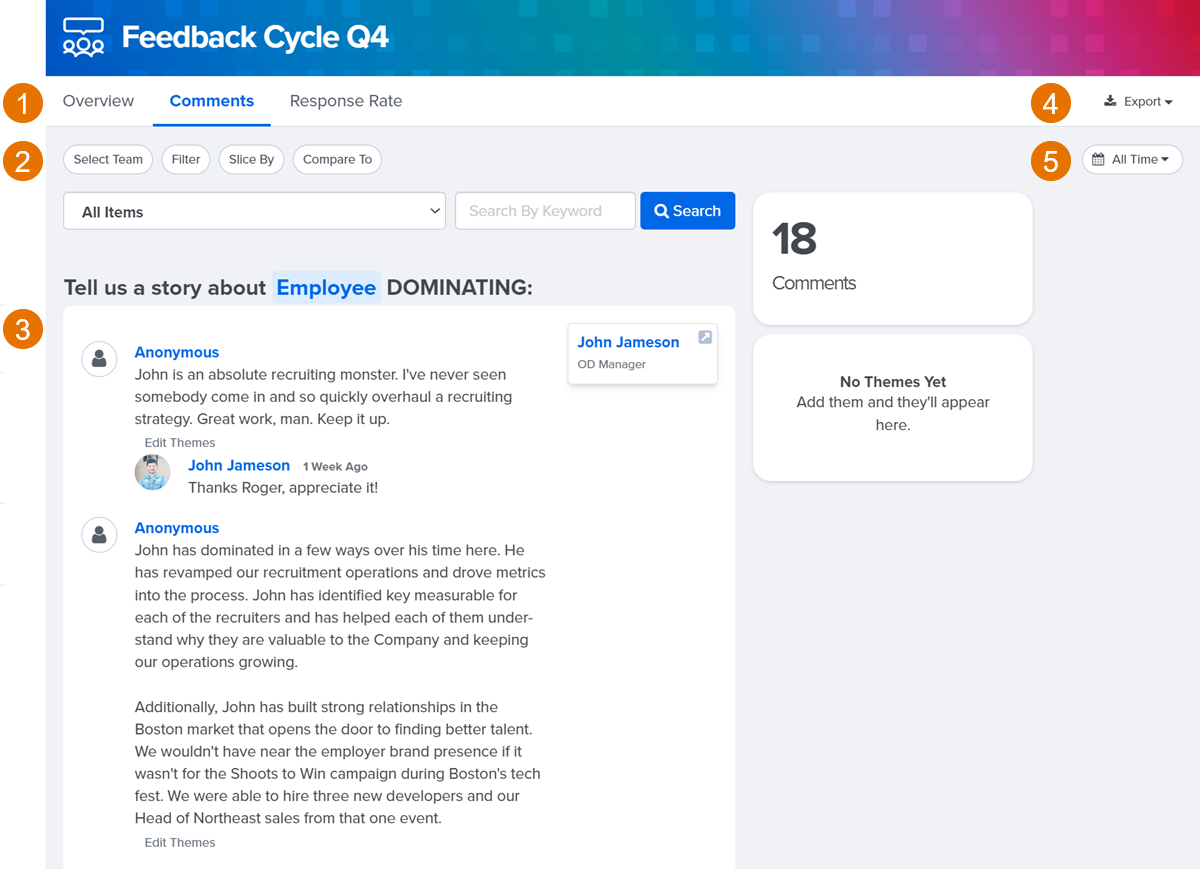
- Tab between Overview and other available reports, depending on Feedback template used.
- When viewing the reports i.e. Comments, Response Rate tabs, etc. use the Select Team, Filter, Slice By and Compare To buttons to view Feedback data from various perspectives.
- To view average scores for each Feedback recipient, click Slice By, then, Participant.
- The Overview tab will only have the Select Team button.
- Where the data for the selected tab is displayed.
- Export the cycle's Feedback results as PDFs or Excel files.
- All Time is enabled by default and displays the Feedback cycle's results for its entire length. To view the results for a specific time period, select from the pre-set dates or set a custom range.
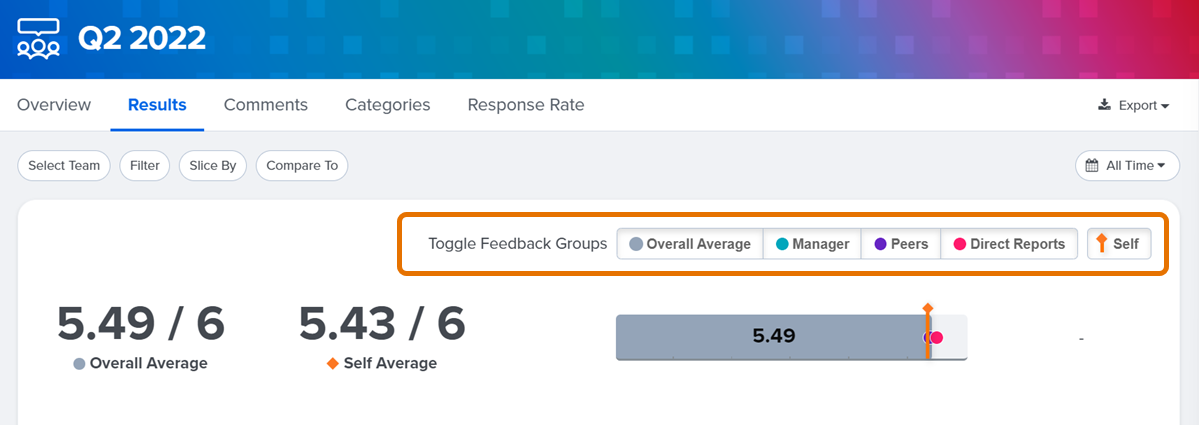
If a Feedback cycle includes scaled agreement questions, the Analytics will include an overall score for all cycle participants. All scaled questions are included unless designated otherwise on the Feedback template.
If you're using Feedback groups, you can toggle views per Feedback Groups. On the Results tab, you'll see all active Feedback Groups. Click on a group to enable or disable the group's average score.
Learn more about Feedback Analytics.
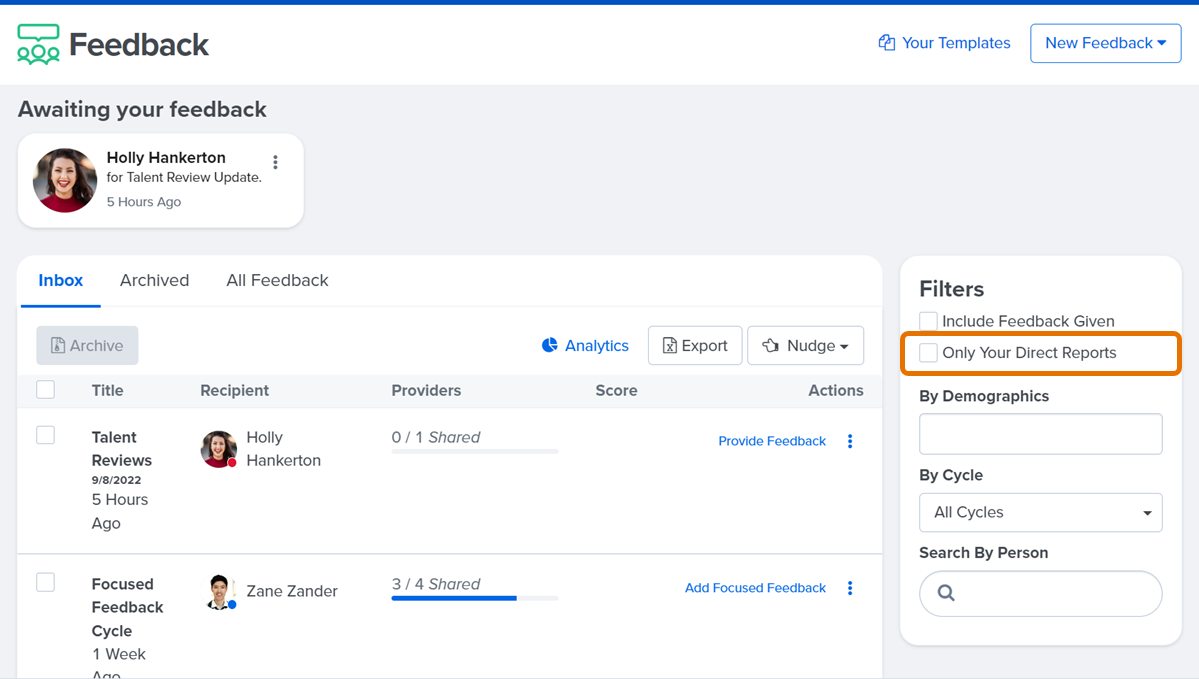
Viewing Feedback for an Admin's Direct Reports
As an admin with direct reports, you can easily filter your view to only see Feedback cycles your direct reports are participating in.
To see your direct report's Feedback activity, click Feedback in the left-hand navigation menu. On the Filters card to the right of the feed, click and enable the Only Your Direct Report checkbox.
1-on-1s
- Tab between Overview and other available reports, depending on 1-on-1 template used.
- When viewing the reports i.e. Comments, Response Rate tabs, etc. use the Select Team, Filter, Slice By and Compare To buttons to view 1-on-1 data from various perspectives.
- To view data for each 1-on-1 separately, click Slice By followed by Participant.
- The Overview tab will only have the Select Team button.
- Where the data for the selected tab is displayed.
- Export the cycle's results as PDFs or Excel files.
- All Time is enabled by default and displays the 1-on-1 cycle's results for its entire length. To view the results for a specific time period, select from the pre-set dates or set a custom range.
If a 1-on-1 cycle includes scaled agreement questions, the Analytics will include an overall score for all participants. All scaled questions are included unless designated otherwise on the 1-on-1 template.
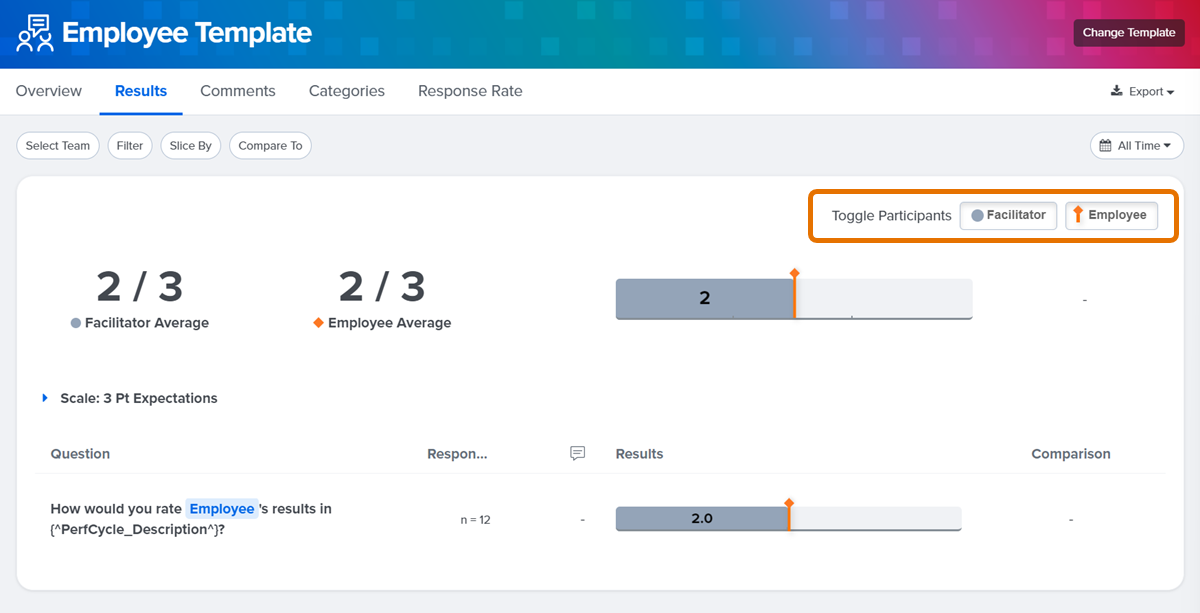
You can toggle view by participant to highlight Facilitator or Employee results. On the Results tab, click Facilitator and Employee to enable/disable their average score.
Learn more about 1-on-1 Analytics.
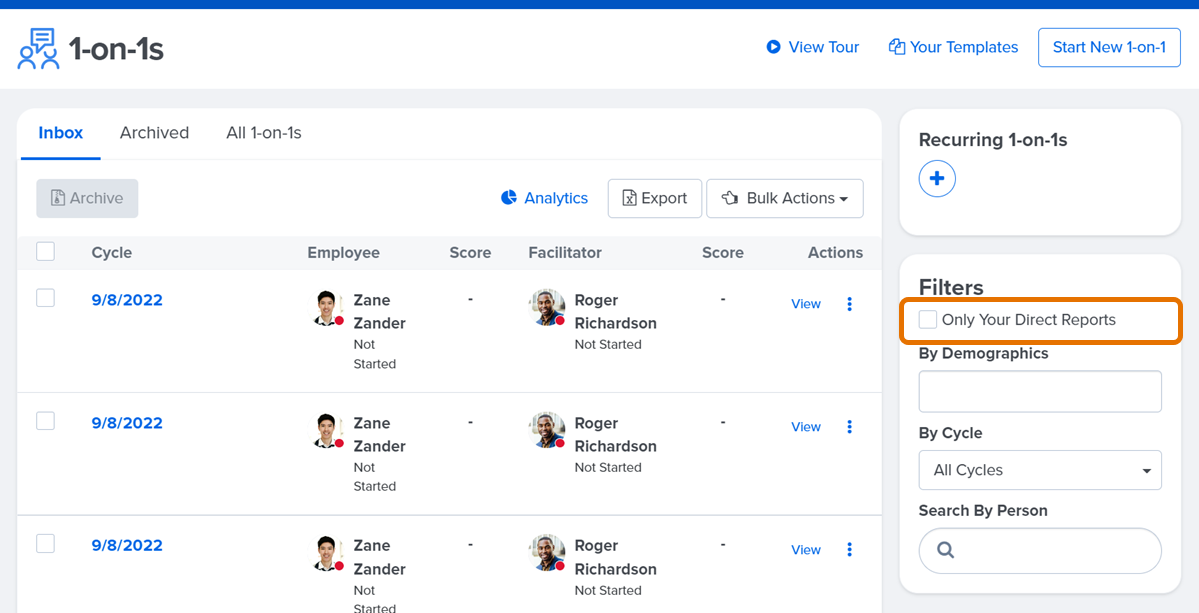
Viewing 1-on-1s for an Admin's Direct Reports
As an admin with direct reports, you can easily filter your view to only see 1-on-1 cycles your direct reports are participating in.
To see your direct report's 1-on-1 activity, click 1-on-1s in the left-hand navigation menu. On the Filters card to the right of the feed, click and enable the Only Your Direct Report checkbox.
Surveys & Pulses
- Tab between Overview and other available reports, depending on the Survey template used.
- When viewing the reports i.e. Comments, Response Rate tabs, etc. use the Select Team, Filter, Slice By and Compare To buttons to view survey data from various perspectives.
- The Overview tab will only have the Select Team button.
- Where the data for the selected tab is displayed.
- Access Settings gives you control over employee visibility into survey results.
- Export the cycle's results as PDFs, Excel or Powerpoint presentations.
- All Time is enabled by default and displays the 1-on-1 cycle's results for its entire length, but can be clicked and customized. Trend Over Time helps make sense of data over time by grouping results by months or quarters.
Slice and filter your survey data by demographics you've included in Quantum Workplace, view trend data for questions asked over multiple surveys and view benchmarks to compare your organization's response to industry averages.
Click here to learn more about Survey Analytics.
Talent Reviews
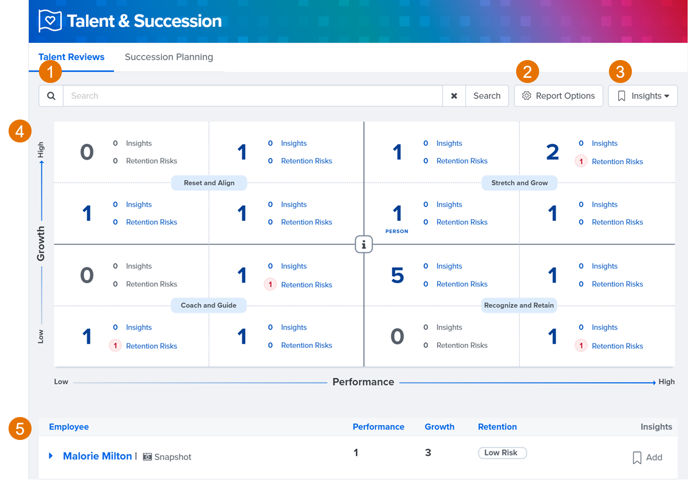
- Search bar to narrow results by employee names or titles.
- Report Options to filter the view by date range or a specified cycle.
- Calibration mode can be toggled on/off here to hide personally identifiable Talent Review ratings when viewing analytics.
- The Insights drop-down allows you to filter results via various insights, i.e. Retention Risk, Stay Interview, etc.
- Where the interactable 16-box grid is displayed. Clicking any of the cells in the grid will highlight associated employees in the Employee section below the grid for greater detail.
- The Employee section displays individual employees that can be clicked to see greater detail.
Talent Reviews give you a central location to view rating information for all employees across your organization via a 16-box grid with each cell highlighting an employee's growth and performance status.
Learn more about Talent Review Analytics.
Succession Planning
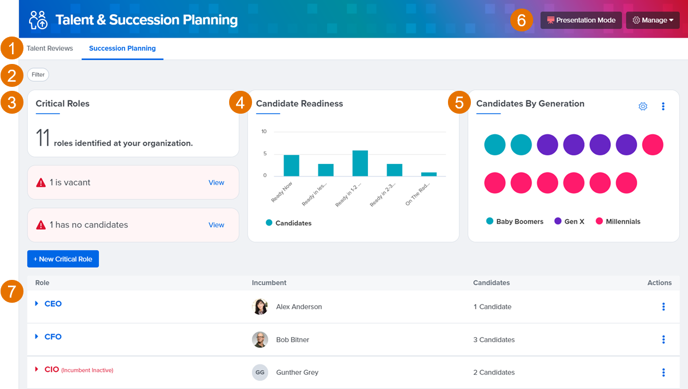
- Tab between Talent Reviews and Succession Planning.
- Filter to quickly view information for vacant roles, roles without candidates or enable a demographic filter.
- Critical Roles identifies the number of roles that require attention, i.e. vacant roles or roles without candidates. You can also click New Critical Role to manually add a new critical role.
- Candidate Readiness provides at-a-glance information regarding the number of candidates categorized by their readiness timeline.
- Candidates By Generation display a color-coded visual for candidates categorized by the selected demographic. The demographic can be changed by clicking the ⋮ icon.
- Role lists all roles in your organization that can be expanded to display the incumbent's profile, identified candidates and nominations. You can also manually add or promote candidates within the expanded view.
Succession Planning provides organizations with an intuitive digital method of identifying critical roles within your organization and helps strategize action plans to fill these critical roles with the right candidates.
Learn more about Succession Planning.