In this article:
- Overview
- Requirements
- Access 1-on-1 Analytics
- Navigate 1-on-1 Analytics
- Reporting Tools
- Overview Report
- Results Report
- Comments Report
- Response Rate Report
- Reporting Exports
Overview
As an admin, use the different reports and exports to analyze and look into your organization's 1-on-1 cycles.
Admins can view any 1-on-1 conversations via the 1-on-1 homepage. 1-on-1 analytics provides a way to look at aggregate data for a 1-on-1 cycle.
Watch a webinar recording on how to use 1-on-1 analytics.
Requirements
- Available to admin users
Access 1-on-1 Analytics
To access 1-on-1 Analytics:
- Click and expand 1-on-1s in the left-hand navigation menu
- Select Analytics
- Click a cycle to navigate to the cycle's analytics Overview tab
Navigate 1-on-1 Analytics
Use the following actions to navigate and view the different reports available to you:

- A. Report Tabs: Click to navigate between different reports
- B. Select Team: Filter the results according to a manager org tree
- C. Change Template: If more than one template was used in the cycle, use this to change the template data displayed in the analytics
- The current template name is reflected in the header, in the example above, the template analytics being shown is titled, Employee Template
- D. Export: Click to export results as PDFs or as an Excel file
Reporting Tools
When viewing the different analytics reports available to you, use the different reporting tools available to you to view data from different angles and compare insightful data points.
- Select Team: Filter the results according to a manager org tree
- Filter: Narrow the results to only display the selected demographic(s). Utilize saved filters for faster, more consistent reporting. Learn more in this step-by-step guide.
- Slice By: Narrow the results to display the sub-demographics of the selected demographic
- For example, if results are sliced by the Location demographic, then the results will reflect that for each location
- All standard demographics are available for use in 1-on-1 analytics, including:
-
-
Age Range
-
Exit Type
-
Generation
-
Immediate Manager
-
Is Manager
-
Job Title
-
Manager Levels
-
Tenure Range
-
-
- Compare To: Allows you to easily see how current results compare to an overall average or to a specific cycle
Overview Report
The Overview tab of 1-on-1 analytics acts as the landing page and highlights cycle highlights such as launch dates, participants, used templates, etc.
To navigate and understand the Overview report:
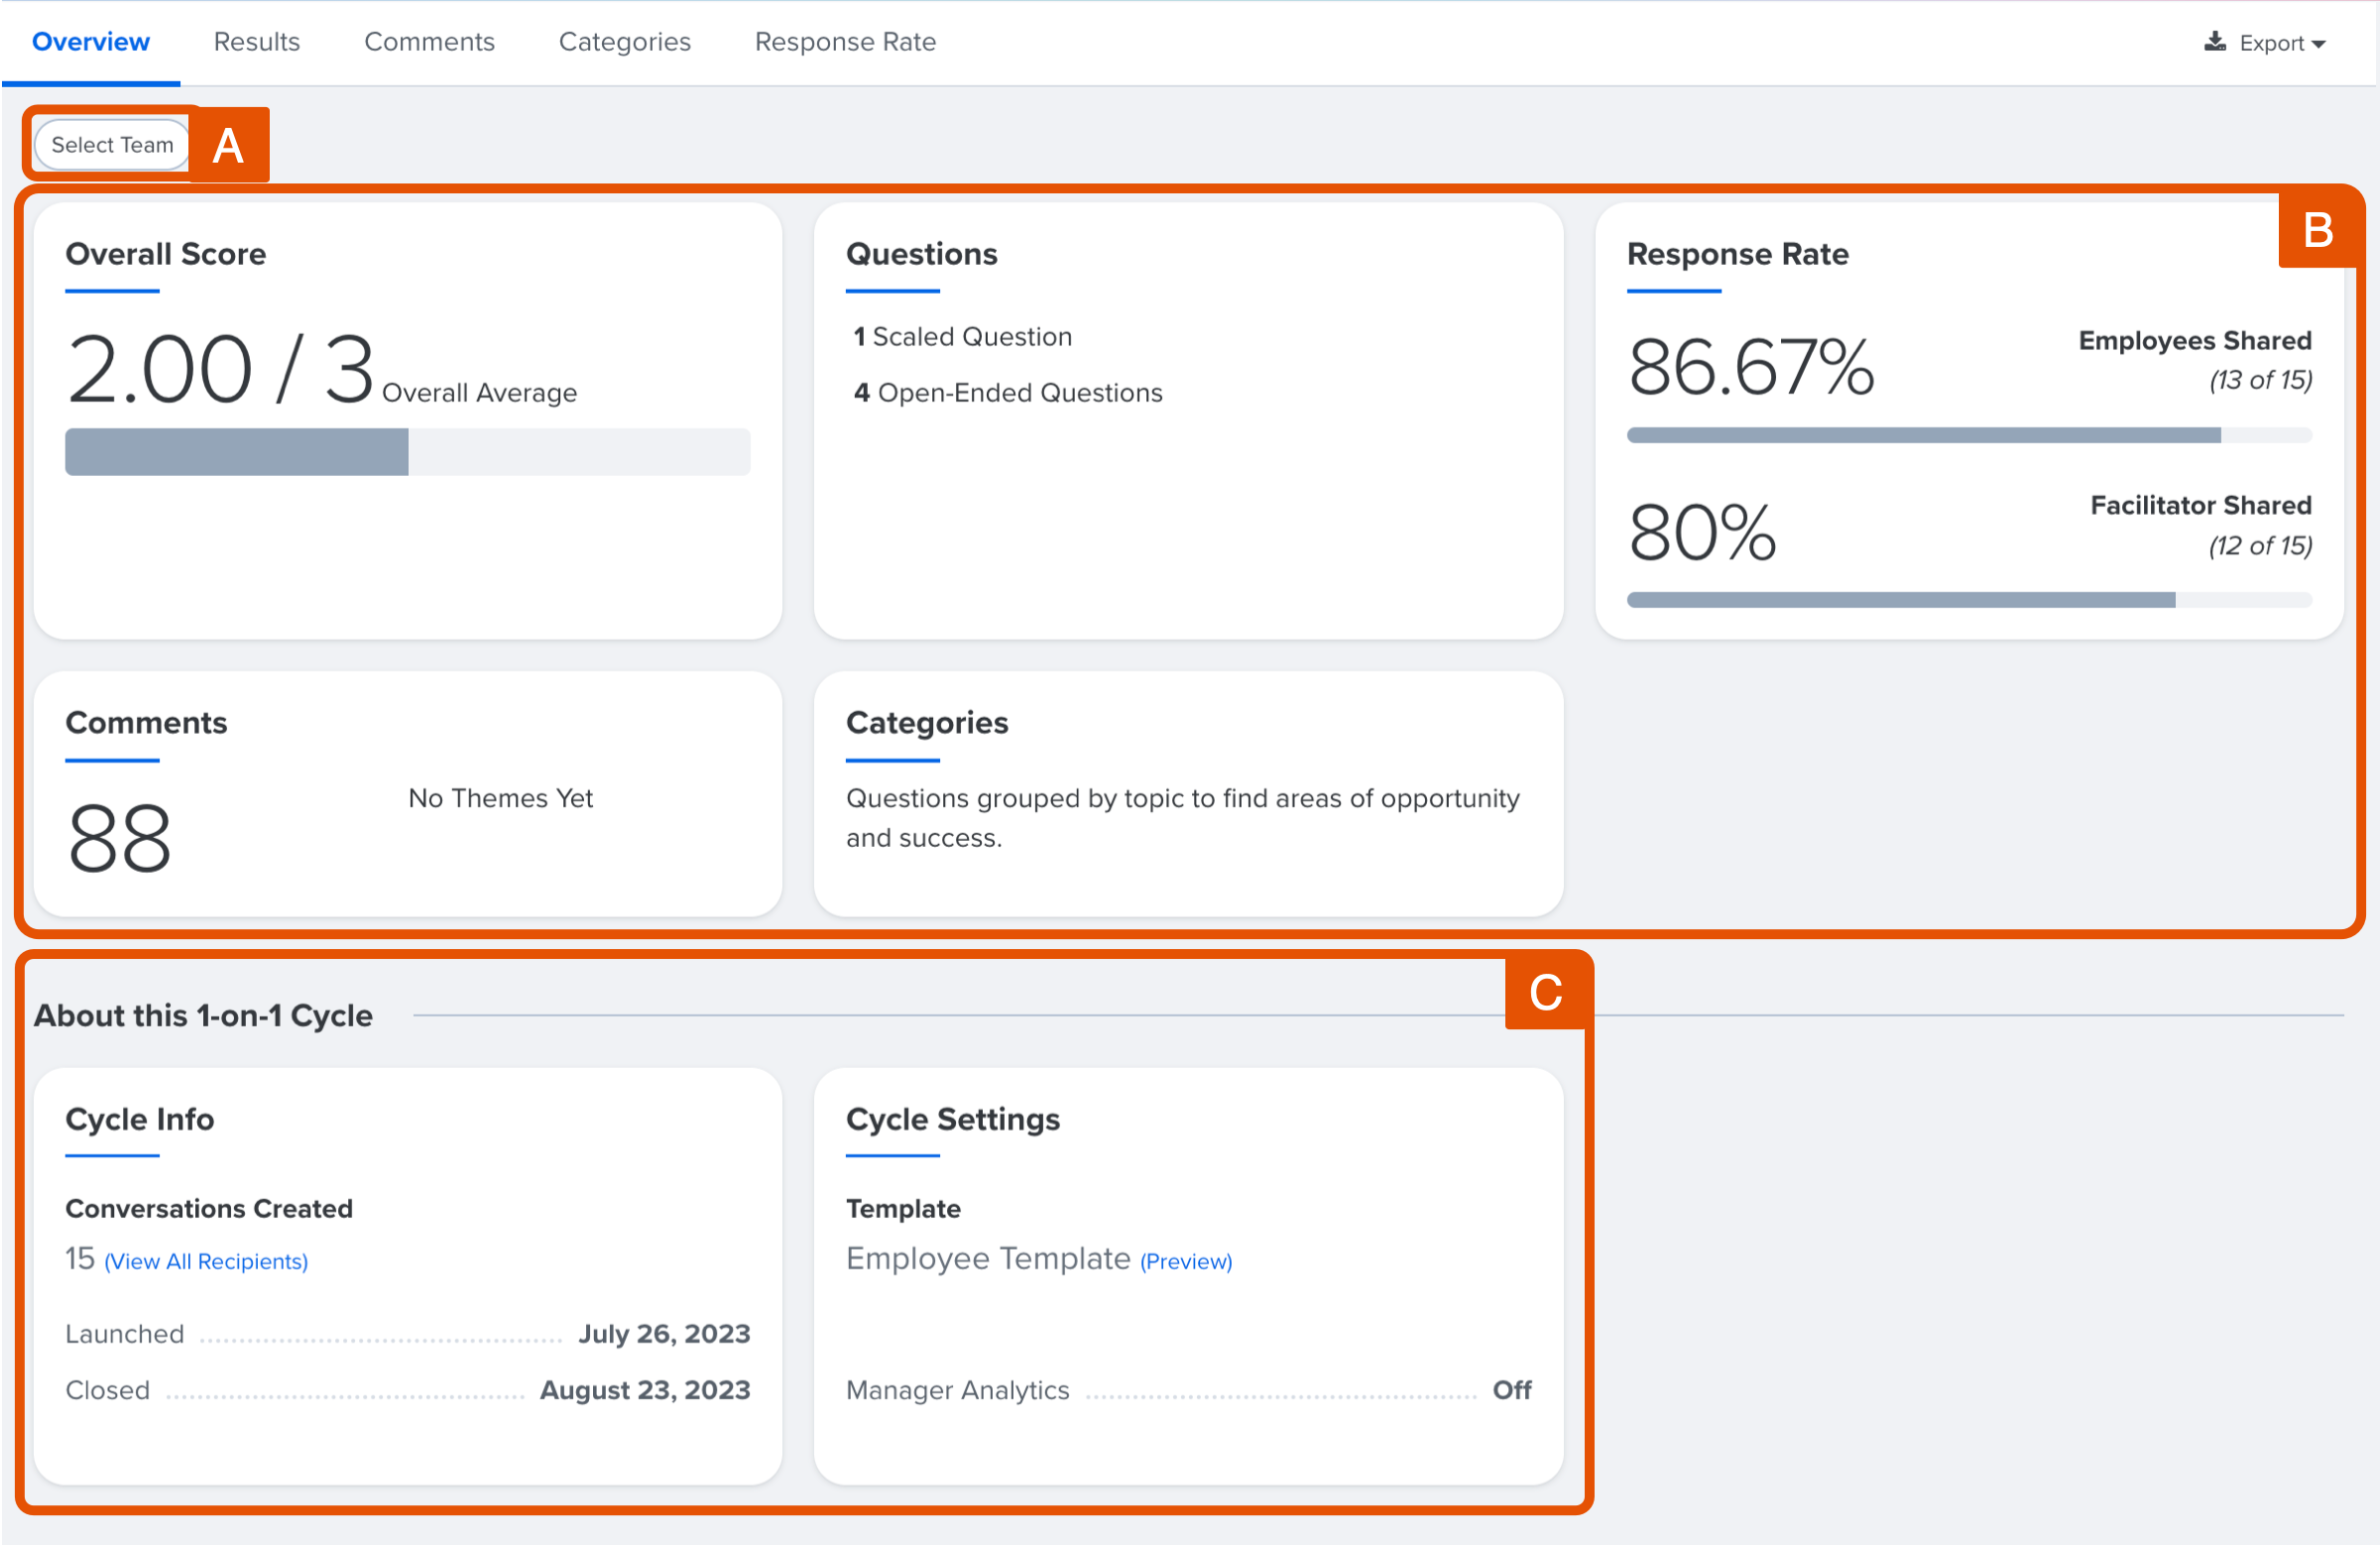
- A. Select Team: Click to narrow the results for a specific team or branch of an org tree
- B. High-Level Results: View at-a-glance results for the cycle
- C. Cycle Details: View cycle details, e.g. cycle participants, dates, and the templates used
Results Report
The Results report provides an overall average of responses for any scaled, NPS, or multi-choice questions broken out by Facilitators and Employees.
To view average scores for the Facilitator or Facilitator group only, click the Facilitator and Employee toggles, seen in Figure C.
To navigate the Results report:
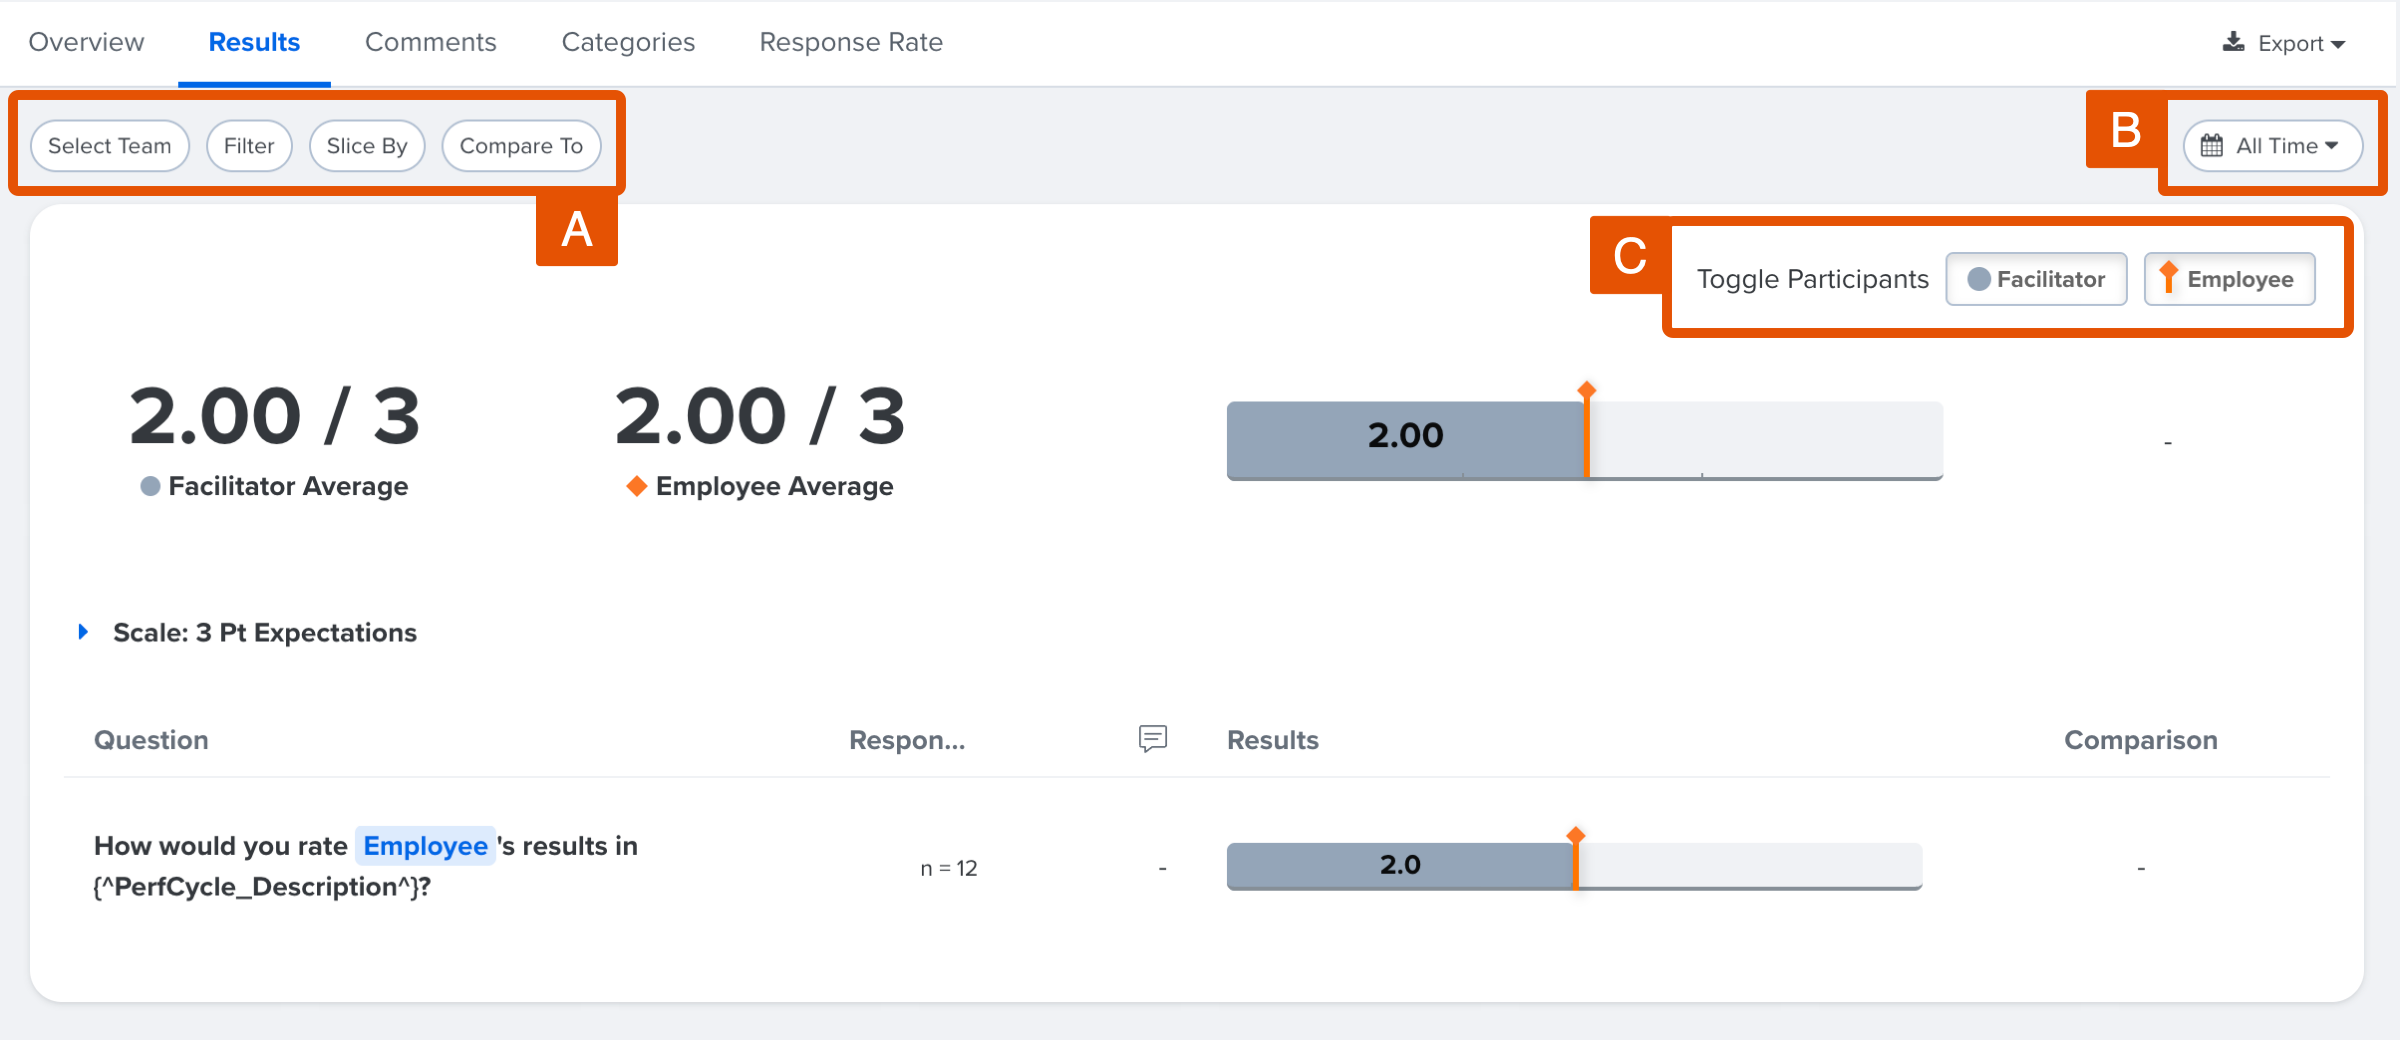
- A. Select Team, FIlter, etc.: Use these features to narrow the results displayed
- B. Time Range: Click to expand a menu with pre-set time ranges or the option to create a custom range
- C. Toggle Participants: Click each group to toggle their visibility on/off
Comments Report
Use the Comments report to view the responses from each 1-on-1 participant for a given question.
To navigate the Comments report:

- A. Select Team, FIlter, etc.: Use these features to narrow the results displayed
- B. Filter by Question/Keyword: Use the drop-down to show comments for a specific question or filter the results based on an entered keyword
- C. Time Range: Click to expand a menu with pre-set time ranges or the option to create a custom range
- D. Question Responses: Displays the responses from the Employee and Facilitator for the given question
- Click the link with the employee's name to navigate directly to the 1-on-1
- E. Comments Count: Indicates the total number of comments according to the active filters, slices, etc.
- F. Comment Themes: If in use, lists each theme and the number of tagged comments
Add & Manage Comment Themes
Custom themes can be added to a comment to organize comments and allow for a larger-scale image of what is being discussed.
Themes can be applied to both, the Employee's and Facilitator's comments.
To add/manage comment themes:

- Click Edit Themes for the Employee or Facilitator's comment
- Enter or select an existing theme
- New Theme: Enter the theme in the field
- Select Existing Theme: Click and expand the drop-down before selecting the theme
- Click Save
- Refresh the page to update the Themes card with the up-to-date theme count
Response Rate Report
Use the Response Rate report to view the completion percentage over the cycle's lifetime, as well as cycle details, i.e. cycle dates, and count of employees/facilitators.
To navigate the Response Rate report:

- A. Select Team, FIlter, etc.: Use these features to narrow the results displayed
- B. Time Range: Click to expand a menu with pre-set time ranges or the option to create a custom range
- C. Cycle Progress: Visualizes the percentage of completion over time
- D. Progress Details: Indicates the cycle's key details
- Click View All under Conversations to view and edit the participant's demographics; demographic changes only affect the cycle, learn more
Reporting Exports
Use the export options to download PDF or Excel versions of the results.
Any active team views, filters, slices, etc. are reflected in the exported data.
To export the results into an external file:

- Click and expand Export in the top-right
- Select the export option to download the PDF or Excel file:
- PDF reports are downloaded to your browser's downloads folder
- Excel files can be downloaded from the Export History menu
Click Export History from the Export drop-down to view a log of exported Excel reports.
One HR platform for connected talent insights. See how Quantum Workplace brings your data together across 1-on-1s, talent reviews, performance reviews, and more—so you can spot trends, act fast, and make more informed people decisions. Explore the interactive product tour or request a personalized demo with your Customer Success Manager.