This article applies to an older version of Quantum Workplace, for the currently supported version see Survey Analytics: Reports or Engagement Survey Analytics: Reports.
This article reviews the different reporting options you have in your dashboard. You may not see all of them due to access restrictions set by your organization.
IN THIS ARTICLE:
- Chart View
- Compare To
- Slice by
- Team Select
- Filters
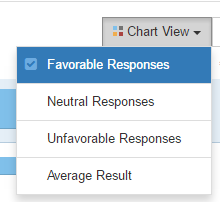
Chart View
Chart View allows your to switch between viewing percent favorable ( strongly agree/agree), neutral (somewhat agree/somewhat disagree), and unfavorable (strongly disagree/disagree) responses. You may also select to view by the average. Note: Average is not a percentage, but a decimal. The highest possible score will depend on how many options there were on the survey. Our standard survey has six options: Strongly Agree, Agree, Somewhat Agree, Somewhat Disagree, Disagree, Strongly Disagree.
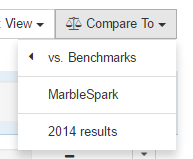
Compare To
Compare To allows you to compare your data to our normative database of more than 5,000 organizations ( vs. Benchmarks), your entire organization (Organization), your previous survey results, or another custom option that may have been created for your organization.
Slice by
Slice by helps you identify demographic groups that are outliers so you can dig deeper. You may compare departments, divisions, or another demographic to one another in one report.
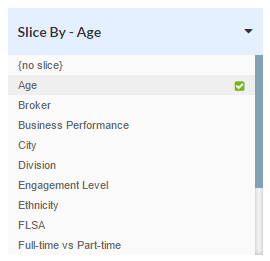
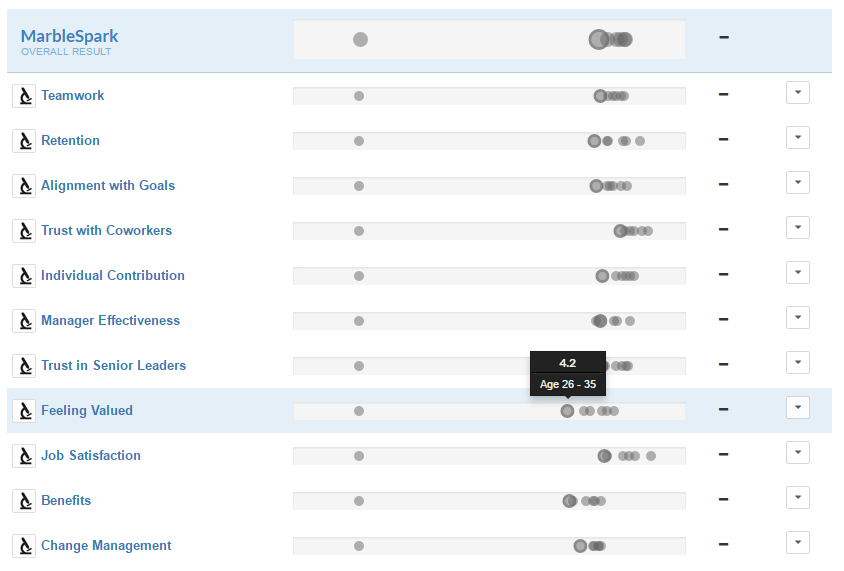
If you click on a dot, it highlights that demographic group throughout the whole report.
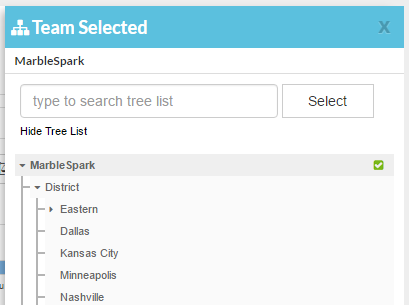
Team Select
Team Select is a hierarchical tree of your organization. If you are looking for a specific department, division, or manager you may use the search feature. The green check mark shows where in the tree you are viewing reports.
Filters
The filter tool allows for easy on-demand custom reports. You may view any report by one or multiple demographic groups. Select the demographics you would like to view, and then click Apply at the top of the filter section. Once a filter is set, it stays on for any report you run until you click Clear.
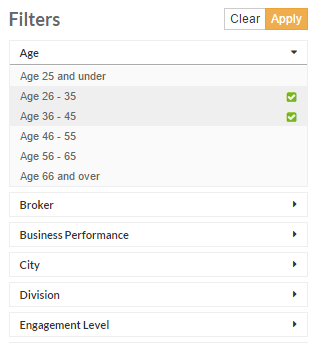
Once you have set a filter you will see a filter is applied at the top of each report along with the total number of employees which fit your current filter. Click 'Show Selected Filters' to see what you have selected.
