Last Updated: March 13, 2026
In this article:
- Overview
- Requirements
- Access Survey Analytics
- Overview & Team Report
- Questions Report
- Engagement Outcomes Report
- Engagement Levels Report
- Comments Report
- Categories Report
- Heat Map
- Response Rate Report
- Action Plan
Overview
As an admin, refer to this article as an overview of the different reports available to you for your Engagement survey's analytics and how to best take advantage of each report's insights.
When you conduct an Engagement survey with Quantum Workplace, the Engagement Survey analytics differ slightly from the analytics for surveys you conduct on any other topic.
The primary difference between Engagement Survey Analytics and other Survey Analytics is that your Engagement Survey Analytics include High Impact items, or the specific survey items that had the biggest impact on overall engagement in your organization.
The Team Report also showcases different data than surveys on other topics.
Requirements
- Available to full admins and survey-admins
- Non-admin users can be granted access via Access Roles, learn more
- Use the Annual Engagement Best Practice survey template when creating a survey
- Survey questions can be added/edited and still receive Engagement Survey Analytics

- Survey questions can be added/edited and still receive Engagement Survey Analytics
Access Survey Analytics
To access analytics for a survey:
- Click and expand the Surveys drop-down menu in the left-hand navigation menu
- Click Analytics
- Click the survey to navigate to its analytics
Reporting Tools
When viewing the different analytics reports available to you, use the different reporting tools available to you to view data from different angles and compare insightful data points.
- A. Filter, Slice By, Compare To:
-
- Filter: Isolate and view survey results by one demographic, e.g. by Department, Gender, Location, etc.
-
Slice By: Select a specific demographic and reveal a range of how the demographic responded to a survey question
In the following example, the results are sliced by Department revealing how the Sales, Finance, and IT departments responded to the question
.gif?quality=high&width=670&height=113&name=2023-02-08_17-27-26%20(1).gif)
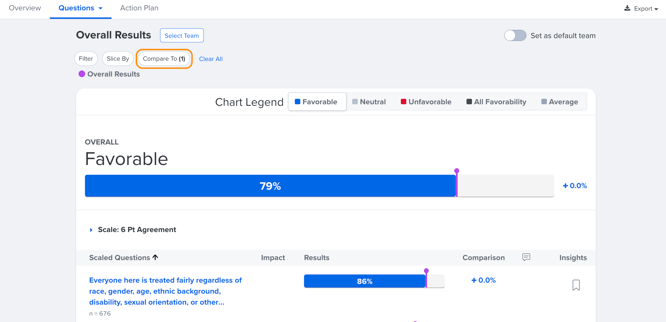
- Compare To: Allows you to compare your results against a benchmark or previous survey
-
Multiple Comparisons
The Compare To function allows you to add up to five comparisons and analyze how your survey results compare against previous surveys and different benchmarks
Comparisons are represented via pins in the results
If only a single comparison is active, the Comparison column is visible and indicates the difference in percentage points
-
B. Export: From any report, export your data as PDFs, Powerpoints, or Excel spreadsheets via the Export button in the upper-right corner
PDF and Excel exports reflect any slices, filters, and comparisons active at the time the report is exported-Excel exports include the actual data points you're examining
Active filters, slices, etc. automatically carry over as you navigate between the different survey reports and are applied to any exports.
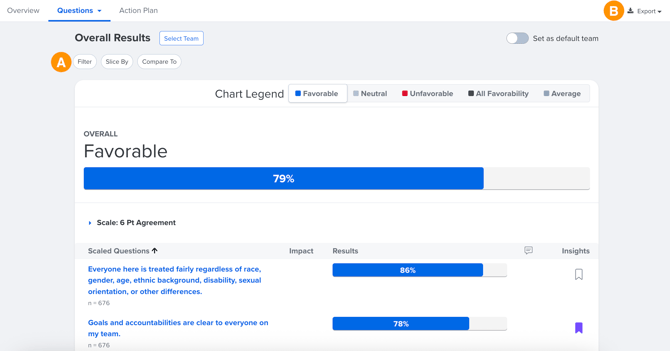
Overview & Team Report
The Overview report presents an overview of the survey results and relevant engagement insights for your entire organization.
Click Select Team and the appropriate org tree branch to view the Team Report, which displays an overview of the survey results specific to the selected branch.
How to navigate the Overview and/or Team Report:


- A. Focus Areas: Quantum Workplace-recommended focus areas to improve or maintain to increase engagement
- Click Discussion Starters to view recommended discussion starters or add customer discussion starters for the Focus Areas and add them to an Action Plan
- Click Previous Focus Areas to view the selected team's previous Focus Areas, if applicable
- B. Organizational/Team Favorability & Response Rate: Displays favorability and participation rate
- Organizational: Includes organization-wide favorability, the favorability difference between the previous engagement survey, and the total participation rate
- Team: Includes the team's favorability, the favorability difference between the previous engagement survey and the organization, and the total participation rate
- Response Rate: Percentage of team members who participated in the survey
- C. Favorability by Categories: Displays favorability levels by question category
- D. High-Impact Questions: Displays the High-Impact questions with the lowest favorability, learn more about High-Impact questions
- Click Show remaining High-Impact Questions to reveal favorability for all High-Impact questions in the survey
- Click the Compared To: drop-down menu to specify what the High-Impact questions are compared against, e.g. previous engagement survey or overall organization favorability
- E. Communicating Your Results
- Click Online Toolkit to download a walk-through on communication best practices and turning results into action
- Click Download Manager's Guide to download a guide to action planning to help get in the right mindset and communicate results effectively
- F. Lightweight 1-on-1s:
- Click Set Them Up Today to schedule a 1-on-1 with direct reports to communicate follow-up actions or create dialogue around survey results, learn more about Lightweight 1-on-1s
When viewing the Team Report, if the minimum number of responses is not reached to protect confidentiality, you are not able to view the complete results in the Team Report.
However, if the survey has at least two responses, you can still view recommended focus areas, use discussion starters, and create action plans.
Here's an example of a Team Report where the minimum number of responses was not met, but there was at least two responses:

Discussion Starters
The Discussion Starter model allows managers and admins to view the survey's standard engagement questions, select relevant discussion starters for each question and organize them for reference and note-taking.
Added discussion starters and any associated notes are specific to the selected team.
This section covers Discussion Starters from Quantum Workplace's Library. Click here to learn more about the Discussion Starter Generator.
To use the Discussion Starter modal:
- Click See Discussion Starters
- Scroll and click the appropriate question(s) in the left half of the modal
- For each survey question, enter information in the General Notes field or use the Discussion Starters to add relevant and actionable ideas to discuss
Lightweight 1-on-1s
Use the 1-on-1s feature from the Team Report to quickly schedule 1-on-1s with direct reports to communicate essential information and foster dialogue around relevant survey questions and topics.
Scheduled 1-on-1s will appear in the inbox of the 1-on-1s page.
To schedule a lightweight 1-on-1:.gif?quality=high&width=670&height=482&name=2023-03-08_14-28-26%20(1).gif)
- Click Set Them Up Today in the Lightweight 1-on-1 Setup card
- Click Set Up for each direct report without a scheduled 1-on-1
- Configure the date and time, and whether the 1-on-1 should recur regularly
- Click Create to finalize and launch the 1-on-1
-
For scheduled 1-on-1s, click the ⋮ icon, then Edit to make changes.
Overview: Live Response Rate
As an admin, you are presented with the following view for an open survey until the survey's analytics are available.

While survey participants complete the survey, take advantage of the available resources to improve response rates and help admins and managers take meaningful action based on the survey results. See the following resources for guidance:
- Improve Your Response Rate
- Admin Post-Survey Toolkit
- Manager Post-Survey Toolkit
- Learn more about the Live Response Rate.
Questions Report
The Questions report displays the favorability score and lists the responses to all of the survey's scaled agreement items which are the majority of survey questions.
Other question types, (i.e. multiple-choice, single-choice, or NPS questions), are also listed in the Questions report.
To navigate the Questions report:
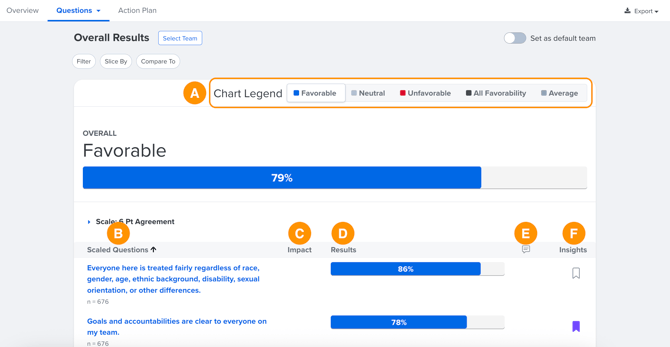
A. Chart Legend: By default, favorable scores are displayed. Additional filtering options include:
-
Favorable: Includes Agree & Strongly Agree responses.
-
Neutral: Includes Somewhat Agree & Somewhat Disagree responses.
-
Unfavorable: Includes Disagree & Strongly Disagree responses.
-
All Favorability: Displays all response categories (Favorable, Neutral, and Unfavorable).
-
Average: Shows the average score on a six-point scale
B. Question & N-Count: The question as it appears on the survey; Hover your cursor over the question to view the number of responses received.
C. Impact: Indicates whether the question is considered a High Impact question
D. Results: Hovering over the results displays Favorability and Overall Average metrics. E. Comments: Displays the number of comments received by survey participants, click to navigate to the Comments report.
F. Insights: Click to create an insight for the question and add it to an action plan, learn more about Insights here.
Engagement Outcomes Report
The Engagement Outcomes reports provide a similar experience to the Questions report but only include Outcome questions in the survey for easier analysis.
This report is available when the following criteria are met:
-
It applies to Engagement and Engagement Follow-Up surveys that contain at least three E9 Engagement Outcome questions.
-
At least one E9 question must be included from each of the following categories: Work Engagement, Team Engagement, and Organization Engagement.
-
Survey questions must use a 6-point agreement scale, with or without the Not Applicable option.
Engagement Levels Report
The Engagement Levels report, available for Engagement and Engagement Follow-Up surveys, provides macro engagement data at the organizational level.
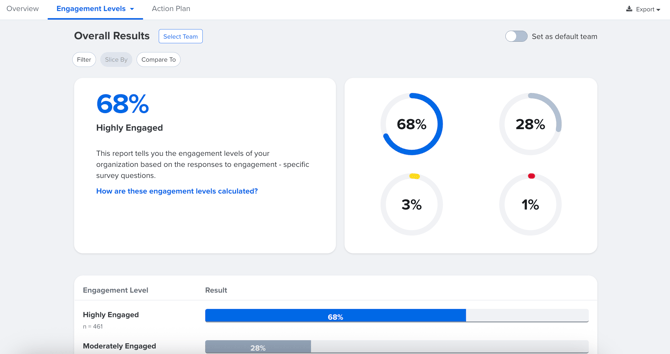
Admins can use this report to share organizational engagement data with relevant stakeholders and assess how engagement and behavior is impacted by Quantum Workplace usage.
This report is accessible if the following conditions are met:
-
It applies to Engagement and Engagement Follow-Up surveys that include at least three E9 Engagement Outcome questions.
-
Among the included E9 questions, at least one must represent each of the following categories: Work Engagement, Team Engagement, and Organization Engagement.
-
Survey questions must follow a 6-point agreement scale, with or without the Not Applicable option.
Learn more about the Engagement Levels report.
Comments Report
All text-based responses submitted by survey participants are captured in the Comments report. This includes responses to all open-ended questions and comments left by participants in response to scaled agreement items. Learn more about the Comments report.
To navigate the Comments report:
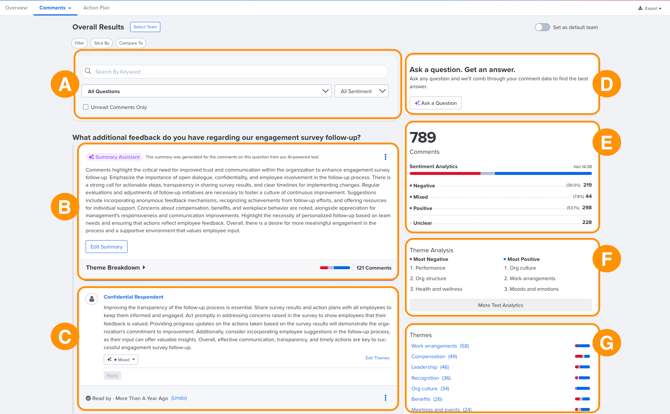
A. Item Filter/Search: Use the drop-down menus or keyword search to filter the displayed comments, or filter the view to only display comments marked unread
- Use the All Questions drop-down to filter the comments by question
- Use the All Sentiment drop-down to filter the comments view by Negative, Mixed, Positive, or Unclear sentiment
- Use the text field to search and show comments by a specified keyword
B. Summary Assistant: Use the Summary Assistant feature to accurately summarize your employees' voices for a survey question, learn more
C. Comment: Relevant comments to the selected question or category that contain the participant's comment, automatically assigned sentiment and theme
- Click Mark as Read to indicate that a comment has been analyzed to better track and organize large numbers of comments
- Click the ⋮ icon to quarantine a potentially damaging comment, learn more about quarantining comments
- To correct a sentiment or theme, click the drop-down or Edit Themes respectively and select the appropriate option
- Click Reply to leave a comment and communicate with the participant who left the comment, learn more about comment replies
D. Ask AI: Use Ask AI to uncover insights from a survey's comments using natural language prompts, learn more here
E. Sentiment Analytics: Provides a visual of the breakdown of the number of displayed comments and their sentiment, learn more about sentiments and themes in the Comments report
F. Theme Analytics: Lists the three most negative and most positive themes
Click More Text Analytics to view theme and sentiment data visually, learn more about text analytics
G. Theme Count/Sentiment: Toggle between displaying themes and the associated amount or the color-coded sentiment
Comment Translations
Survey comments come in all languages. The Comments report offers the users side-by-side translations.
- Translated comments contain a Show Original Language button, which allows readers to see the comment as written and understand the original language and translation source.
- The keyword search returns matches from both the original and translated comments.
- Translations, including the original and translated language, are included in the Excel report. Although the original comment is not included in the PDF export, the translation source, if needed, can be accessed in the report.
- Quantum Workplace can source translations from an online translation service for free or from a team of professional linguists for an additional fee.
- Contact your CIM/CSM for any comment translation-related questions.
Categories Report
The Categories report provides favorability information similar to the Questions report but at the category level.
To navigate the Categories report:
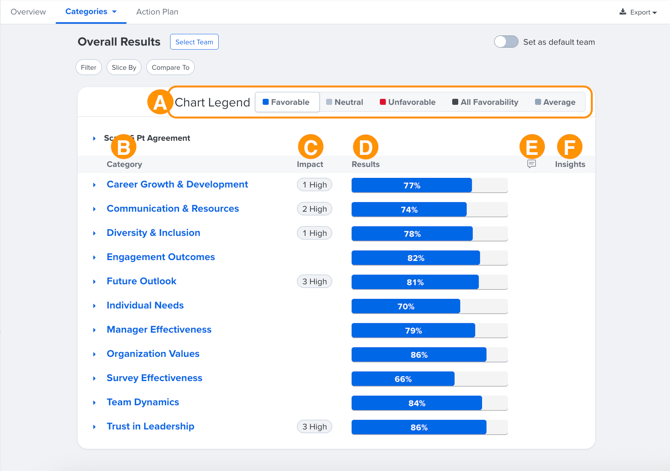
A. Chart Legend: By default, favorable scores are displayed. Additional filtering options include:
-
Favorable: Includes Agree & Strongly Agree responses.
-
Neutral: Includes Somewhat Agree & Somewhat Disagree responses.
-
Unfavorable: Includes Disagree & Strongly Disagree responses.
-
All Favorability: Displays all response categories (Favorable, Neutral, and Unfavorable).
-
Average: Shows the average score on a six-point scale.
B. Categories: Displays each question category along with its favorability score. Expand a category to view the individual questions and their associated scores.
C. Impact: Indicates the number of High Impact topics included in each question.
D. Results: Hover over results to show Favorability and Overall Result metrics.
E. Comments: Shows the number of comments submitted by survey participants. Click to navigate to the Comments Report for detailed responses.
F. Insights: When a category is expanded, click the ribbon icon to create an insight for a specific question and add it to an action plan. Learn more about Insights here.
Heat Map Report
The Heat Map report provides a visual representation of how different groups within a demographic, i.e. Departments, Locations, etc., responded to scaled agreement items and categories on the survey.
When viewing the Heat Map, the leftmost column represents the average favorability score across all demographics currently being sliced by. Depending on your role, this column indicates varying information:
- Full admins & survey-admins: this column averages favorability for the organization overall
- Focused admins: this column indicates average favorability within their scope
- Managers: this column indicates average favorability within their downline
The Heat Map uses a white-blue color scale, with white indicating low favorability and blue indicating high favorability. As favorability increases, the cell will gradually take on a deeper blue gradient.
- The first row of the Heat Map displays the Response Count or the number of responses being represented.
Note: Response Count information is not included when exporting to Excel.
How to use the Heat Map:
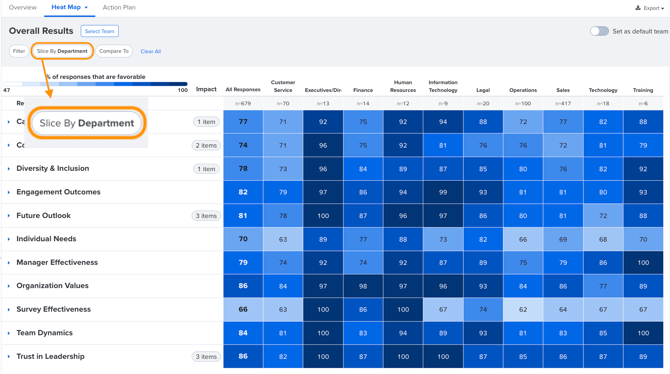
- From Surveys & Pulses under the Analytics in the left-hand navigation menu, click the survey
- Click the Heat Map tab
- Click Slice By
- Click Apply to view the heat map according to the sliced demographic
-
In the Slice By modal, click Add Intersection to add an additional demographic and view intersectional data. This will reflect the results for the two selected demographics.
-
To view the individual results for questions within a category, click the drop-down arrow.
Note: Heat Map Results will appear once a Slice is applied.
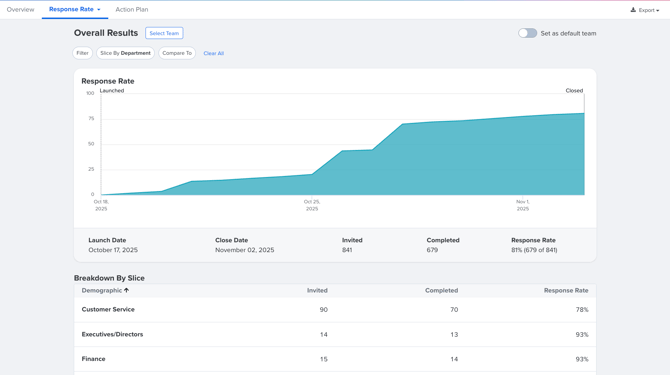
Response Rate Report
The Response Rate report displays the percentage of survey participants who completed the survey and shows how the completion rate changed over the survey period.
This report also includes a list of invited survey participants. Attributed surveys will indicate the identity of the participant and their completion status. Confidential surveys do not indicate whether an invited participant has completed the survey or not.
This report is available as soon as the survey launches to track the response rate in real-time.
For reporting purposes, click Edit Participant Demographics to update a user's demographics.
Any changes to a user's demographics only affect the selected survey.
Action Plan
The Action Plan tab enables teams and organizations to create actionable solutions around a survey's most impactful questions.
Learn more about Action Planning.

One HR platform for connected talent insights. See how Quantum Workplace brings your data together across 1-on-1s, talent reviews, performance reviews, and more—so you can spot trends, act fast, and make more informed people decisions. Explore the interactive product tour or request a personalized demo with your Customer Success Manager.