In the Engagement Profiles report, you can view employees’ engagement level compared to the different comparisons to which you have access. You can also view engagement by the different demographics within your organization.
Click here for more information on the calculations and definitions for the Engagement Profiles.
IN THIS ARTICLE:
- Video: I'm a visual learner; show me how.
- Quick Step-by-Step: Give me the shortened version on what I need to know.
- Full Notes: I want an in depth walk-through of the report functionality.
- Tips & Tricks: What else should I know?
Video: Watch & Learn
Quick Notes
Filter
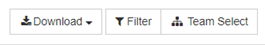
- Click on the Filter button.
- To filter by a demographic, scroll down and click on the demographic you want to filter by. Then click on the options you want to select them. Finally, click the Apply button.
Full Notes
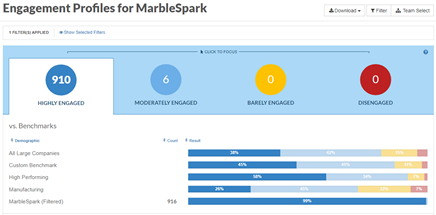
First, you have the option switch which profile the report focuses on by clicking on the different Engagement Profiles at the top of the report.
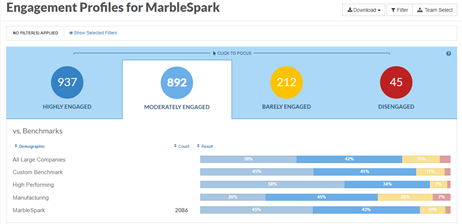
To view the specific survey items that were used to calculate the profiles, click on the question mark icon in the upper, right-hand corner of the blue box.
Under each section of the report, you can click on the headings for Demographic, Count, and Result to sort the report.
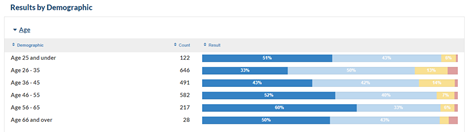
As you scroll down the report, you can view the profiles based on demographics for your organization. Simply click on the arrow to expand the information under each demographic.
Adding a Filter
To focus in further on a specific population, you can also apply a filter(s) to this report by clicking on the Filter button in the upper, right-hand port of the screen.
- To Filter by a demographic, click on the Filter button.
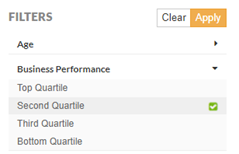
- Then under Filters, click on the demographic you want to filter by.
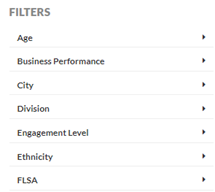
- Select the options for that demographic (Second Quartile in the example below) and then click on the yellow Apply button.
- The Engagement Profiles report will update based on the demographic you selected.
- If you select two (or more) options for a specific demographic, the report will display the combined results for each option selected.
Tips & Tricks
- Click on one of the profiles at the top of the report to view that bucket.
- If you want to know the items used to calculate the profiles, click on the question mark icon.
- You can filter the report if you like and apply multiple filters.
- Don’t forget about our minimum threshold. If you filter down to fewer than 5 responses, you will get our insufficient responses message.
- To get rid of a filter, click on Filter again and then click on the Clear button.