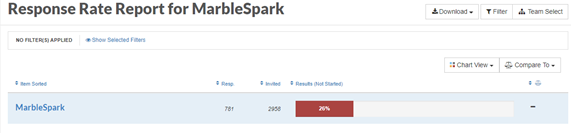
The Response Rate report shows the percentage of started and completed surveys for your organization.
Response Rate report shows the percentage of started and completed surveys for your organization.
IN THIS ARTICLE:
- Video: I'm a visual learner; show me how.
- Quick Step-by-Step: Give me the shortened version on what I need to know.
- Full Notes: I want an in depth walk-through of the report functionality.
- Tips & Tricks: What else should I know?
Video: Watch & Learn
Quick Step-by-Step
Slice and Filter
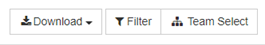
- Click on the Filter button.
- To slice by a demographic, click on the Slice By option.
- To filter by a demographic, scroll down and click on the demographic you want to filter by. Then click on the options you want to select them. Finally, click the Apply button.
Chart View
- Click on the Chart View button.
- Pick the option you want to see – Complete + Started, Completed, Started, Not Started.
Compare
- Click on the Compare To button.
- Pick your option. You can pick your previous year if you’ve surveyed with us before, or your organization as a whole.
- You will see a pin for the comparison option you picked. Hover over it to see more details.
Full Notes
To view this report by any demographic (division, department, etc.), follow these easy steps:
- Click on the Filter button in the upper, right-hand portion of the screen.

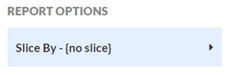
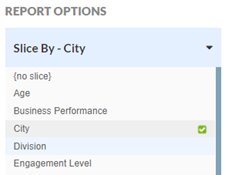
- To slice by a demographic, click on the blue, Slice By option under Report Options.
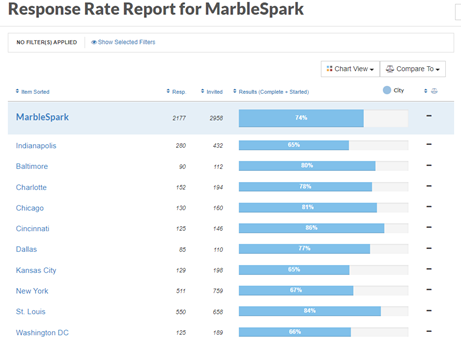
- Click on the demographic you wish to slice by (we picked City in the example below).
- The Response Rate report will update based on the demographic you selected.
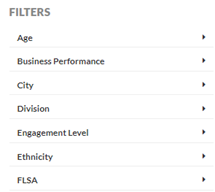
- To Filter by a demographic, click on the same Filter button.
- This time, under Filters, click on the demographic you want to filter by.
- Select the options for that demographic (age 26 – 35 in the example below) and then click on the yellow Apply button.
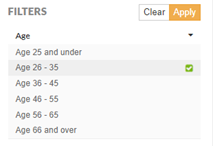
- The Response Rate report will update based on the demographic you selected.
You may also use Chart View to view only completed, only started, or not started surveys:
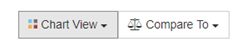
- Click on the Chart View button.
- Select the option you want to see. In the example below, we picked Not Started.
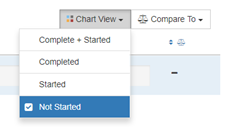
- The Response Rate report will update to show the option you picked.
If you want to compare to your previous year’s results or to your organization a whole, you can do that too!
- Click on the Compare To button.
- Pick the option you want to compare to (we picked 2017 results below).
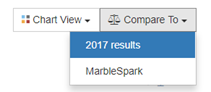
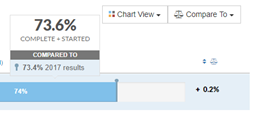
- You will see a pin for the comparison option you picked.
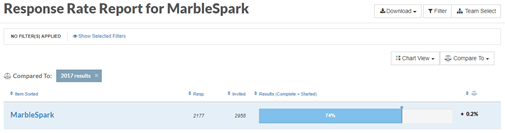
- If you hover over the pin, you will see a pop-up with all of the details of the comparison.
Tips and Tricks
- You can combine slicing and filtering.
- You can apply as many filters as you like but can only slice by one demographic at a time.
- Don’t forget about our minimum threshold. If you filter down to fewer than 5 responses, you will get our insufficient responses message.
- To get rid of a slice, click on Filter and then Slice By again. This time, pick the {no slice} option.
- To get rid of a filter, click on Filter again and then click on the Clear button.