- Help Library
- Surveys & Pulses
- Surveys & Pulses (Legacy)
-
Getting Started Guides & Toolkits
-
Surveys & Pulses
- Launch Surveys
- Survey Templates
- Survey Design & Customization
- Manage Surveys
- Action Planning
- Analytics & Reporting
- New Hire & Exit Surveys
- Survey Participant FAQs
- For Managers
- For Administrators
- Best Practices
- Survey Communications & Email Notifications
- Survey Text Messaging
- Surveys & Pulses (Legacy)
-
1-on-1s
-
Performance Reviews
-
Feedback
-
Goals
-
Recognition
-
Talent Reviews & Succession Planning
-
General
-
Release Notes
-
Intelligence
-
Best Places to Work
-
Training Webinars
Understanding the Overview Report (Legacy)
The Overview report gives you a preview of your team's results. At the top we start with your response rate, average favorability (e.g. the percentage of strongly agree and agree responses), and a breakout of your employees' engagement levels. From each section you can click a button to view a full report on the data.
This report can be downloaded to PDF using the button in the top right.
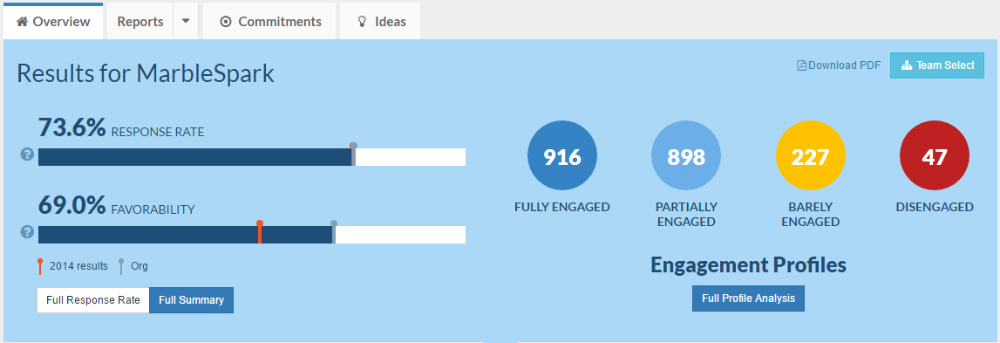
Engagement Profiles
Fully Engaged: average score across all items is 5.0 – 6.0
Partially Engaged: average score across all items is 4.0 – 4.9
Barely Engaged: average score across all items is 3.0 – 3.9
Disengaged: average score across all items is 1.0 – 2.9
If you have access to multiple teams in your organization structure, you can click the Team Select button to switch between teams in viewing reports.
Next in the report we show your Engagement Drivers. You can sort this section by clicking "Item Sort", "Results", or the comparison icon. By using the Chart View menu, you can select to view these items by percent favorable, neutral, unfavorable, or average score. With the Compare To menu, you can see how your results compare to your organization, previous years' results, or benchmarks. (Note: All of these comparison options my not be available to you.)
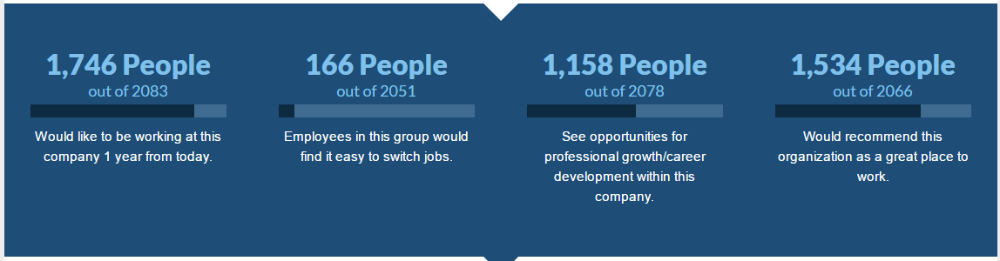
The next section shows you a few statics about your team based on question on the survey.
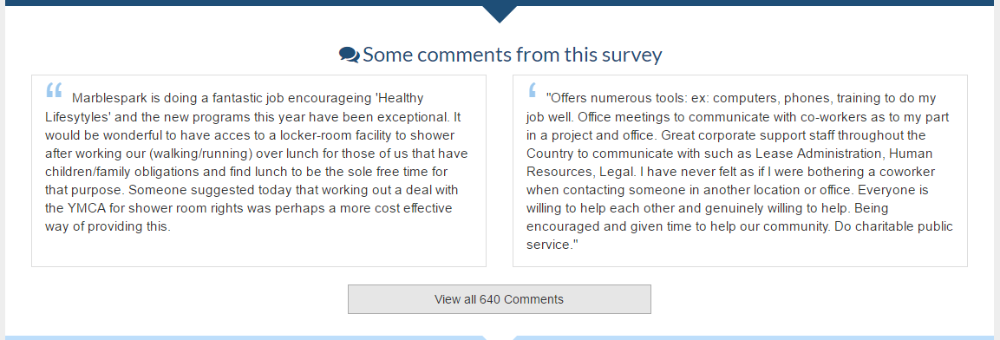
 If you were granted access to comments, you will see a few comment teasers and have the ability to view the full comments report for your team.
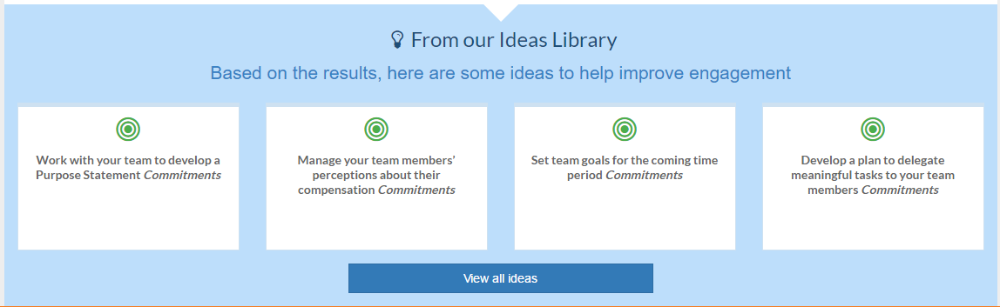
 The bottom section of the Overview report gives you suggestions on what to work on in your Commitment Plan.