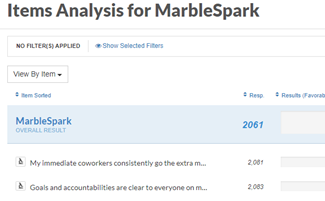
The Items report allows you to view all scaled survey items from your survey.
IN THIS ARTICLE:
- Video: I'm a visual learner; show me how.
- Quick Step-by-Step.
- Full Notes
- Tips & Tricks: What else should I know?
Video: Watch & Learn
Quick Step-by-Step Notes
Slice and Filter
- Click on the Filter button.
- To slice by a demographic, click on the Slice By option.
- To filter by a demographic, scroll down and click on the demographic you want to filter by. Then click on the options you want to select them. Finally, click the Apply button.
Chart View
- Click on the Chart View button.
- Pick the option you want to see – Favorable Responses, Neutral Responses, Unfavorable Responses, All Favorability, Average Result.
Compare
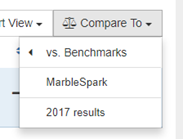
- Click on the Compare To button.
- Pick your option. You can pick your previous year if you’ve surveyed with us before, benchmarks, or your organization as a whole.
- You will see a pin for the comparison option you picked. Hover over it to see more details.
Full Notes
Slicing
You can slice this report by any demographic (division, department, etc.) using the following steps:
- Click on the Filter button in the upper, right-hand portion of the screen.

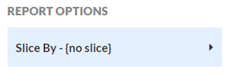
- To slice by a demographic, click on the blue, Slice By option under Report Options.
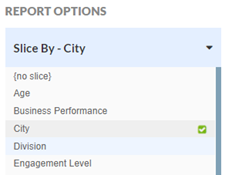
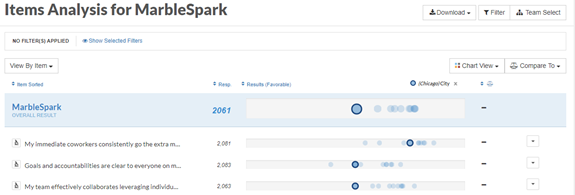
- Click on the demographic you wish to slice by (we picked City in the example below).
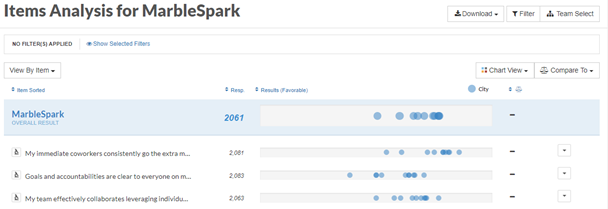
- The Items report will update based on the demographic you selected. The site drops in a data point for each demographic option. This is a great way to identify outliers in your organization.
- If you hover over any of the data points, the corresponding data points will be highlighted through the rest of the categories.
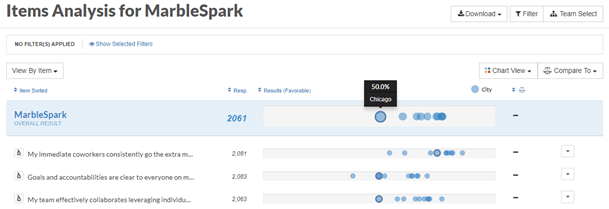
- To bring those data points out even more, click on one of the data points.
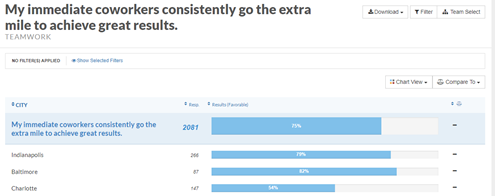
- To view detailed information for a particular item, click on the microscope icon next to the item.
- This will take you to the detailed view for that particular item with a list of each of the options for the demographic you have sliced by.
Filter
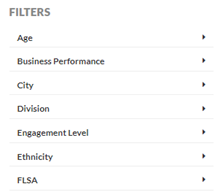
- To Filter by a demographic, click on the same Filter button.
- This time, under Filters, click on the demographic you want to filter by.
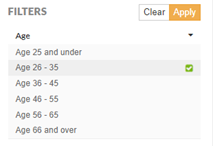
- Select the options for that demographic (age 26 – 35 in the example below) and then click on the yellow Apply button.
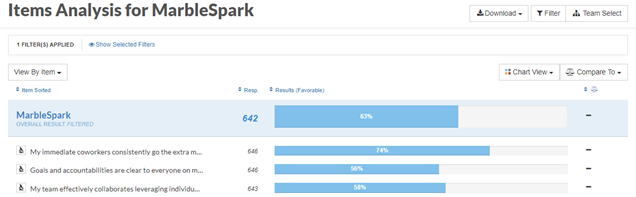
- The Items report will update based on the demographic you selected.
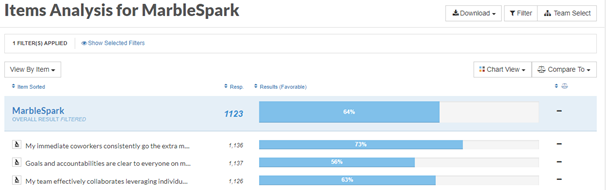
- If you select two (or more) options for a specific demographic, the report will display the combined score for the options selected. In the example below, we selected both Age 26-35 and Age 36-45.
- You can combine a filter with a slice. If you slice by a demographic and then select two or more options for that demographic as a filter, you will see the data points for the filtered selections. In the example below, we sliced by City. Then, we picked Chicago and Kansas City for the filter. Instead of seeing all the data points for all of the cities, we are only seeing two data points – one for Chicago and one for Kansas City.
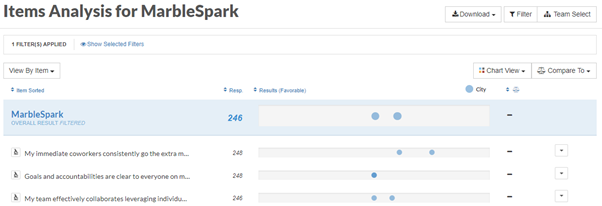
Chart View
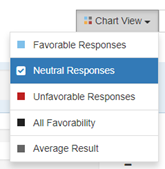
By default, we display favorable responses on our reporting site. You may use Chart View to view favorable, neutral, or unfavorable responses. You can also view all favorability and the average results.
- Click on the Chart View button.
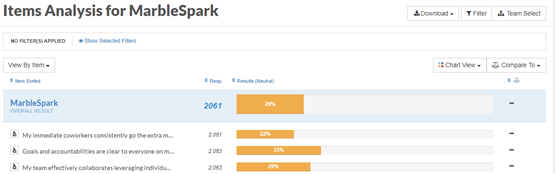
- Select the option you want to see. In the example below, we picked Neutral Responses.
- The Items report will update to show the option you picked.
Compare To
If you want to compare to your previous year’s results, your organization a whole, or benchmarks you can do that too!
- Click on the Compare To button.
- Pick the option you want to compare to (we picked 2017 results below).
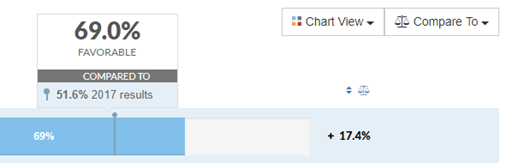
- You will see a pin for the comparison option you picked.
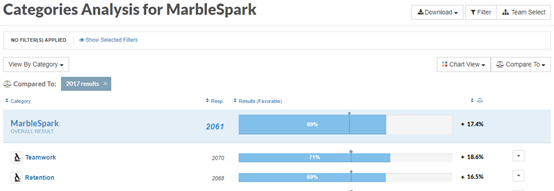
- If you hover over the pin, you will see a pop-up with all of the details of the comparison.
Tips & Tricks
- You can combine slicing and filtering.
- You can apply as many filters as you like but can only slice by one demographic at a time.
- Don’t forget about our minimum threshold. If you filter down to fewer than 5 responses, you will get our insufficient responses message.
- To get rid of a slice, click on Filter and then Slice By again. This time, pick the {no slice} option.
- To get rid of a filter, click on Filter again and then click on the Clear button.
- Click on the microscope icon to view more details – especially when you have a slice turned on.