- Help Library
- Surveys & Pulses
- Surveys & Pulses (Legacy)
-
Getting Started Guides & Toolkits
-
Surveys & Pulses
- Launch Surveys
- Survey Templates
- Survey Design & Customization
- Manage Surveys
- Action Planning
- Analytics & Reporting
- New Hire & Exit Surveys
- Survey Participant FAQs
- For Managers
- For Administrators
- Best Practices
- Survey Communications & Email Notifications
- Survey Text Messaging
- Surveys & Pulses (Legacy)
-
1-on-1s
-
Performance Reviews
-
Feedback
-
Goals
-
Recognition
-
Talent Reviews & Succession Planning
-
General
-
Release Notes
-
Intelligence
-
Best Places to Work
-
Training Webinars
FAQ: How is the n value calculated? (Legacy)
Several of the reports within your Engagement Survey reporting site display the n value, or number of survey respondents who responded to a particular survey item or category.
Items Report
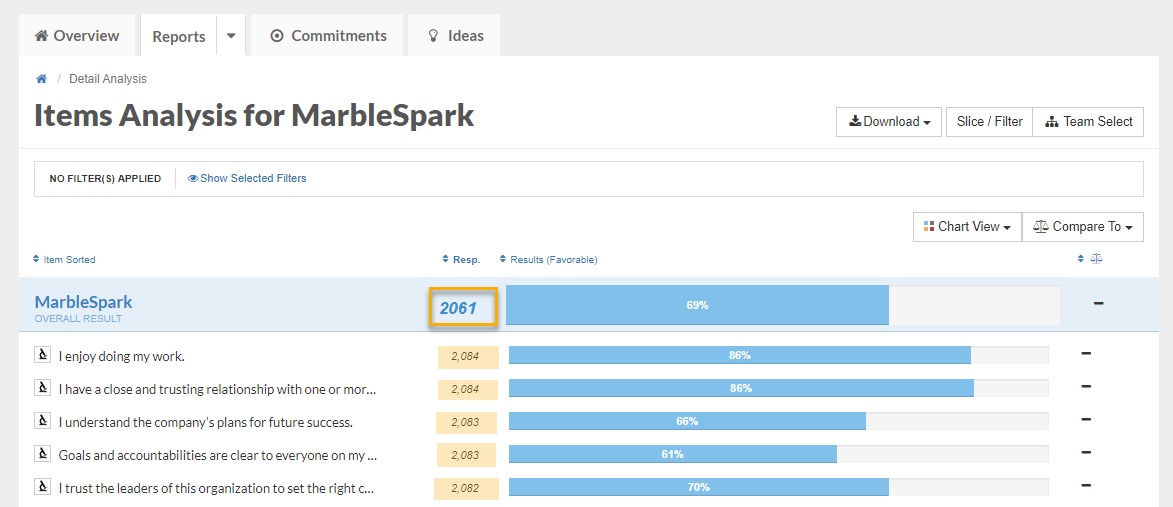
In the Items Report, the n value next to each survey item represents the number of people who answered that survey item. The n value next to the overall favorability at the top represents the average number of n values across all survey items (all questions on the survey).
Categories Report
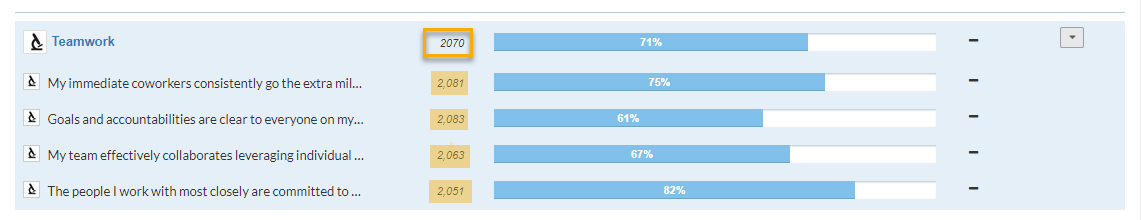
In the Categories report, the n value next to any given category represents the average n value across all survey items within a particular category. The n value displayed by the overall favorability at the top is the same n value you see in the items report, which represents the average number of n values across all survey items. 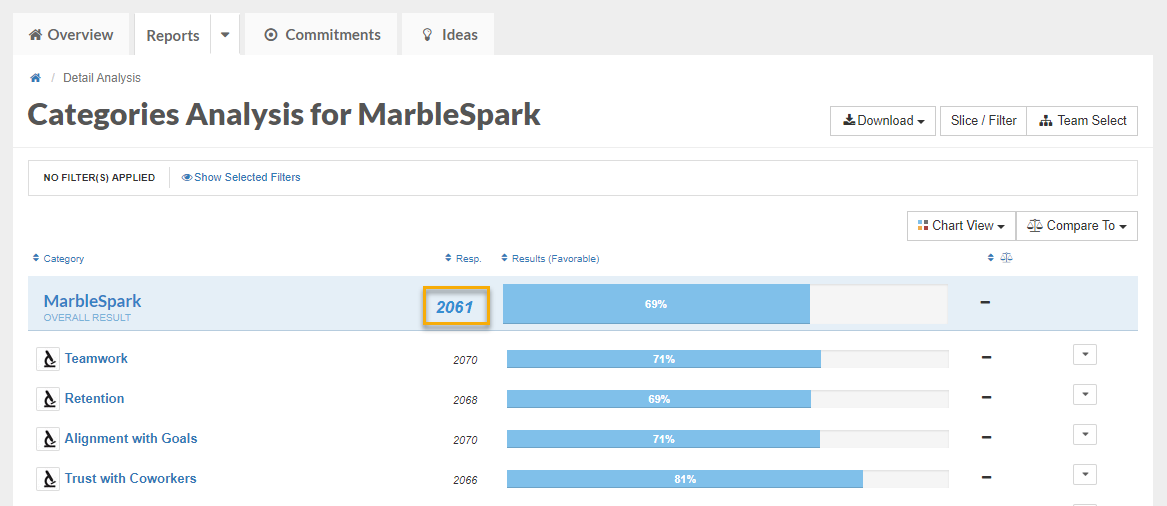
Response Rate Report
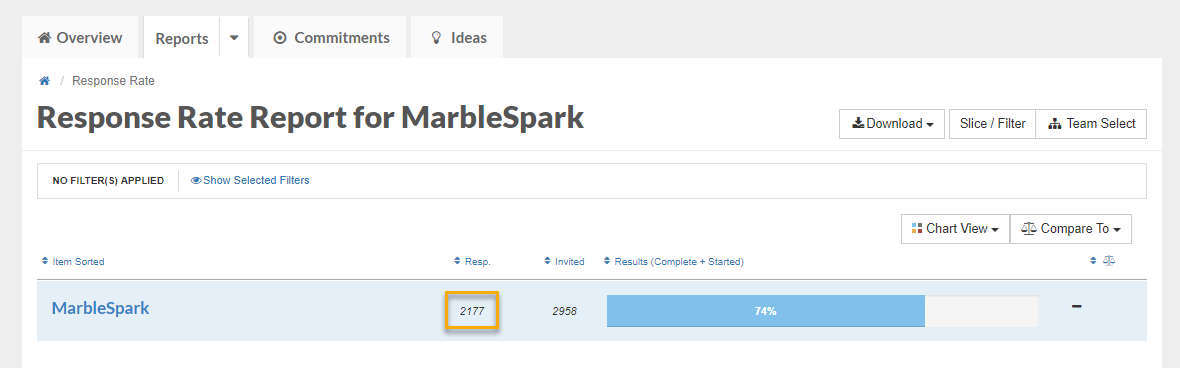
The Response Rate Report shows the exact number of people who responded to your survey. On the left under the Respondents header, you'll see the number of people who answered one or more survey questions (not the number of people who answered every question on the survey). On the right, you'll see the number of people who were invited to take the survey.
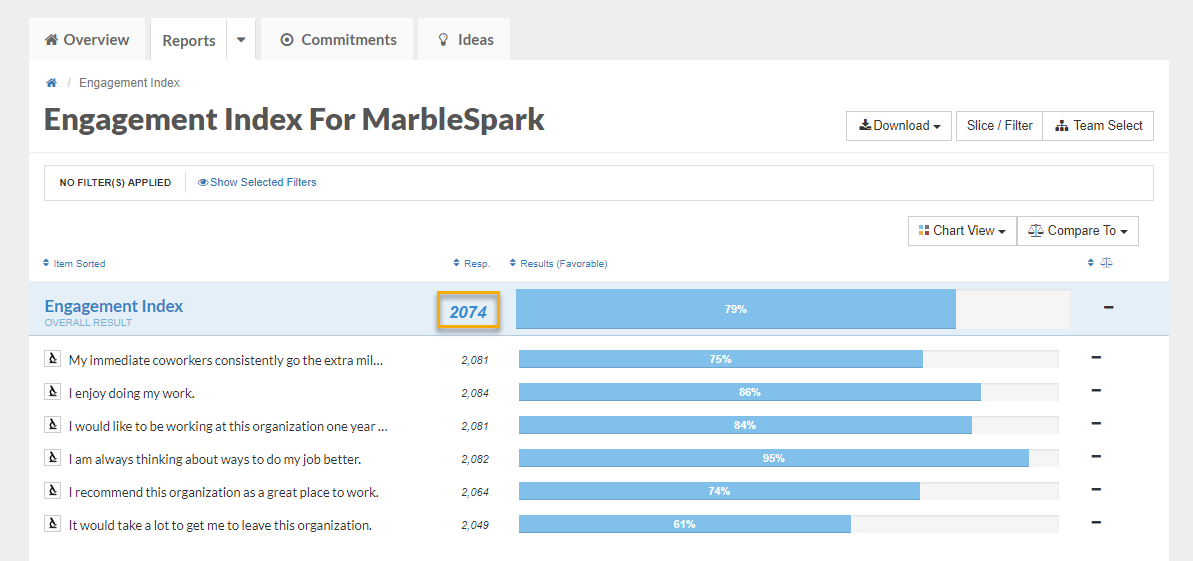
Engagement Index Report
The Engagement Index Report displays data for the Engagement Outcome Items only (you will have a maximum number of 9 Engagement Outcome items in your survey). The n value you see at the top represents the average number of people who responded to these engagement outcome items only.