In this article:
- Overview
- Requirements
- Access the Results PowerPoint Report
- Filters & Team Select in the Export
- Comparisons
Overview
A PowerPoint export is available for a survey's resulting analytics.
The PowerPoint export contains slides that identify important aspects of the survey, such as engagement*, High Impact questions*, overall and question favorability, etc.
*Slides are only available for Engagement Surveys.
Additional Resources:
Requirements
- Available to full admin and survey-admin users
- Available to users with access to Survey Analytics
- Available for surveys with a minimum of one scaled survey question
- Available to be exported in all supported languages
Access the Results PowerPoint Report
To export and access the Results PowerPoint report:

- Click and expand the Analytics drop-down menu in the left-hand navigation menu
- Click Surveys & Pulses from the drop-down menu
- Click the survey name to open the survey's analytics
- Click the Export button to expand the drop-down menu
- Click Results PowerPoint to begin the export
- Click the export file from your browser's download files
Filters & Team Select in the Export
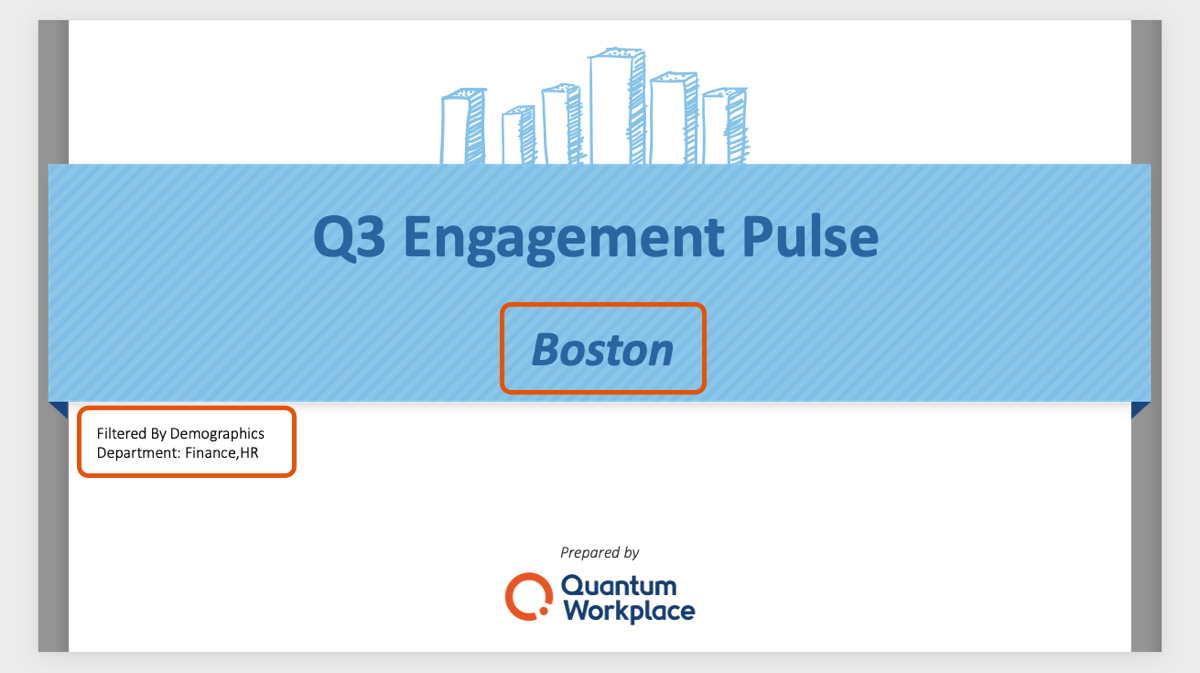
The Results PowerPoint export reflects the team view and any active filters at the time of the export.
For example, the following image displays the PowerPoint export for:
- Team: Boston
- Filters: Department: Finance and Department: HR
Comparisons
- PowerPoint exports for Engagement Surveys compare favorability for the current survey against the previous Engagement Survey that shares common questions.
- If an Engagement Survey does not carry over the same questions from the previous survey, the report will compare favorability against the organization's overall results.
- Non-Engagement surveys compare favorability against an organization's overall results.
When viewing the PowerPoint comparisons:
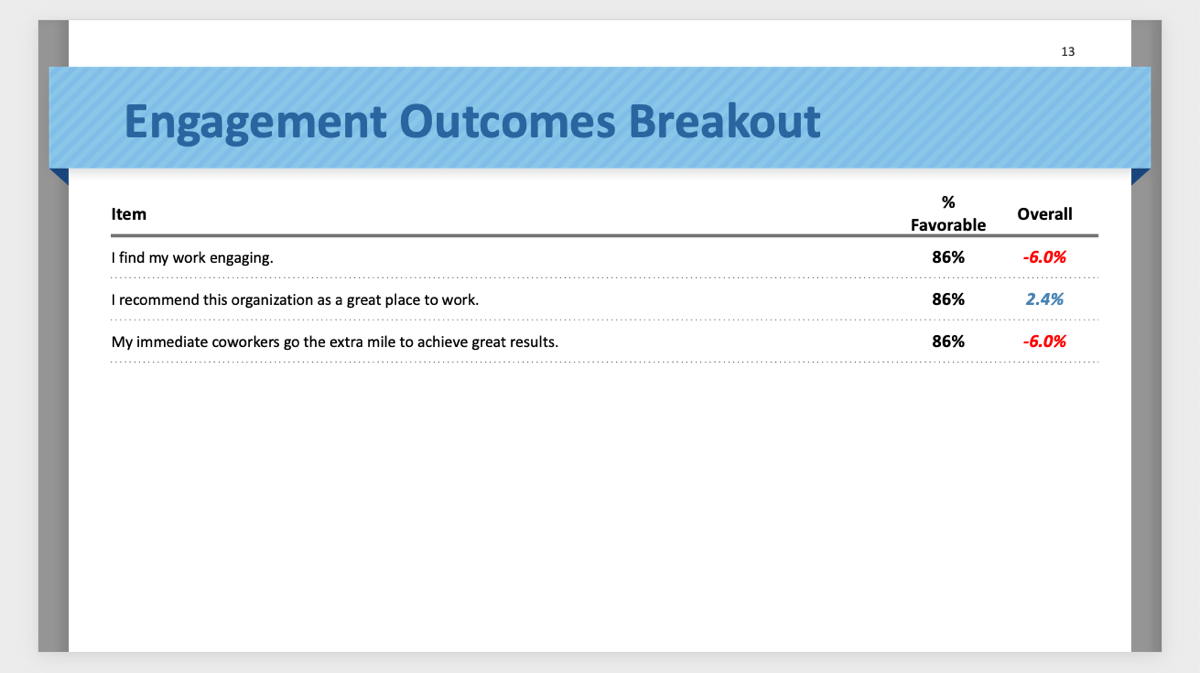
- Favorability Column: Displays the favorability for the selected team and active filters
- Overall Column: Displays the favorability for the entire organization
One HR platform for connected talent insights. See how Quantum Workplace brings your data together across 1-on-1s, talent reviews, performance reviews, and more—so you can spot trends, act fast, and make more informed people decisions. Explore the interactive product tour or request a personalized demo with your Customer Success Manager.