- Help Library
- Best Places to Work
- Understanding your Reports (through 2019)
SWOT Report
Strengths are the top three scoring items based on percent favorable (Strongly Agree and Agree answers).
The key at the bottom of the report indicates what each bar represents. For example, under Opportunities, the first bar is your data, the second bar is the benchmark, and the third bar is the difference between the two.
Weaknesses are the bottom three scoring items based on percent favorable (Strongly Agree and Agree answers).
Opportunities show your three biggest strengths compared to the external benchmark, i.e. where does your company score higher than other organizations.
Threats show your three biggest weaknesses compared to the external benchmark, i.e. where does your company score lower than other organizations.
The key at the bottom of the report indicates what each bar represents. For example, under Opportunities, the first bar is your data, the second bar is the benchmark, and the third bar is the difference between the two.
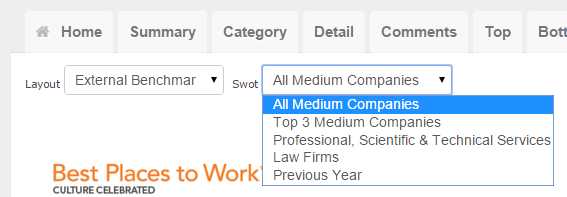
SWOT Menu:
Changing the SWOT selection allows you to discover your Opportunities and Threats when compared to other companies of the same size, your region, your industry or last year’s data.
To access the various SWOT options, you will need to first select the Benchmark Layout.
To access the various SWOT options, you will need to first select the Benchmark Layout.