Track Point in Time Survey Data with Highlights
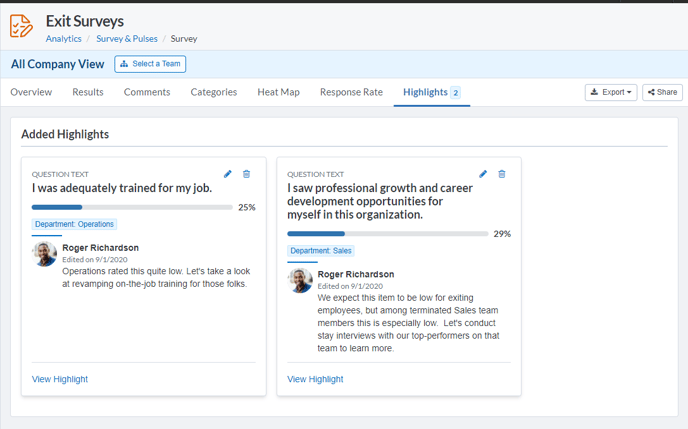
If you’ve used Survey Analytics recently, you are likely familiar with Highlights, which allow you to bookmark specific data points that you want to keep top of mind or call to your colleagues’ attention. You can highlight the response to any survey item with or without a slice, filter, or comparison applied, giving you the option bookmark how the organization overall responded to a survey item or hone in on how particular departments, locations, or other demographic responded to that survey item and examine how responses differed between groups.
Now Highlights give you the ability to track point in time data. Going forward, every highlight you create will include a preview showing the data point on the particular date that you created the highlight. This means that for automated surveys (e.g. new hire and exit surveys) in which the survey analytics change as employees continue to take the survey, you can use highlights to track how the responses to that item have changed over time.
For example, if you slice your New Hire Survey by department and notice a disparity in how favorably different departments rated the item “I have the materials and equipment I need to do my job”, you can highlight that item with the slice applied and return to the survey analytics at a later date to see whether you were able to improve perceptions on that item for your lower-scoring departments.
The ultimate goal of any survey is to provide you with actionable feedback to improve employee perceptions. Capturing highlights about key survey data over time provides a new way to track the success of any actions you take to improve employee perceptions on automated surveys.
Noteworthy 📝
Easily View the Scale within an Individual Feedback Report
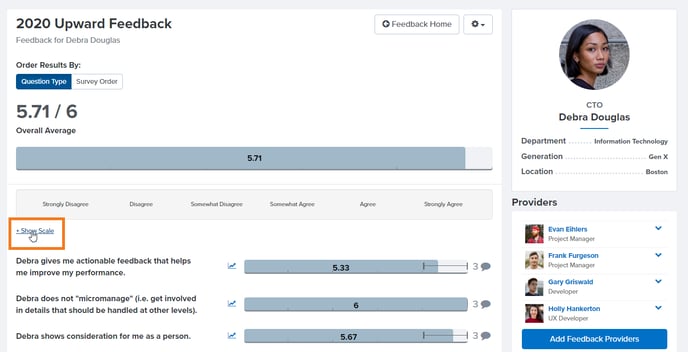
Previously, when employees viewed feedback they had received from their coworkers, the responses to any scaled items that were included in the Feedback appeared without the labels that were used on that scale. As a result, employees missed out on the context of knowing the specific scale that their coworkers’ were using to rate them. Now, employees can click Show Scale to reveal the scale that their colleagues used to provide feedback for them.
View Survey Results for Employees without Reporting Relationships
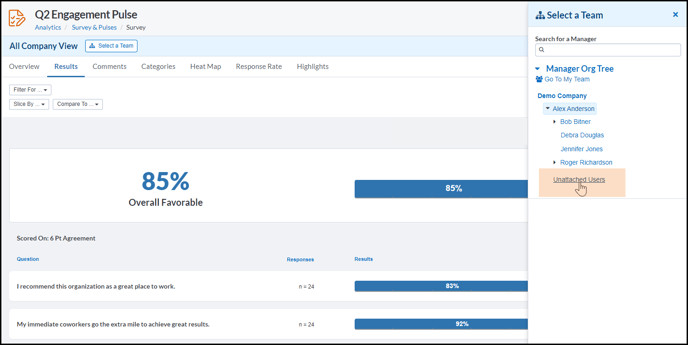
When you view your Survey Analytics you can use the Select a Team button to switch between viewing different teams’ survey results and viewing results for the organization overall. Previously, the Manager Org Tree that appears in this panel did not include a way to access survey results from survey-takers who did not have a manager listed in Quantum Workplace, since these employees were not assigned to a manager on your organization tree. Now you’ll be able to view aggregate survey data for any employees who are not assigned on the Manager Org Tree by clicking Unattached Users.
Fixed
Goals:
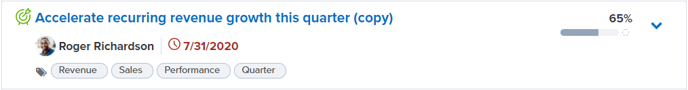
We fixed an issue within Goals which would cause a goal to appear as "overdue" on its due date. Now goals will not be flagged as overdue until the day after their due date.