Last Updated: March 13, 2026
In this article:
Overview
As an admin, use the Retention Radar to gain valuable insight into employee flight risk and turnover.
The Retention Radar identifies groups at high risk of leaving and highlights their specific concerns, enabling the organization to address high-impact issues, avoid regrettable turnover, and cultivate a more stable, engaged culture. This report is always up-to-date with the latest flight risk, termination data, and employee voice data for the Groups of Interest it tracks.
Retention Radar can also incorporate Succession Planning data, allowing you to view demographics such as Succession Incumbent and Succession Candidate to better assess flight risk among top talent.
Watch a webinar recording on the Retention Radar.
For an optimal experience with the Retention Radar:
- Establish an HRIS integration for automatic new hire and exit data, learn more
- Launch Exit surveys with Quantum Workplace, learn more
Requirements
- Available to full admin users, learn more about the different admin roles
- Available to organizations with an up-to-date flight risk calculation, learn more about the flight risk calculation
- Note: Use the Survey Quality Check during the survey setup to ensure the survey updates your organization's flight risk calculations, learn more
Navigate the Report Tab
Use the Retention Radar's Report tab to view automatically identified and generated groups of interest based on turnover trends and high concentrations of flight risk. Three groups of interest are identified for you when you first access the report.
To navigate and understand the Report tab:

- A. Demographics: Specifies the demographics for the employees in the group of interest
- B. Group Overview: Indicates the percentage/number of employees considered high-risk for the given group
- C. Topics of Concern: Signals low-scoring survey questions for the group, including those that differ considerably from the organization's average
- D. Suggested Actions: Contextual and actionable solutions to consider when addressing the group's low-scoring survey questions
- E. Assign & Manage Group Owner(s): Assign admin and non-admin users limited visibility into the demographic group to delegate turnover risk efforts
Demographics
Specifies the demographics for the employees in the group of interest.
The specified demographics are derived from the current user file, which is why Retention Radar requires that user demographics are accurate and up-to-date. To check the state of your current user demographics, navigate to Administration, then Users, then click the Export button to view the complete user file. Learn more.
Organizations that use Talent Reviews can utilize the data connection to incorporate Talent Reviews data into Retention Radar. Data is available for both the 9-box and four quadrant setup. The standard four quadrants include:
- Coach and Guide
- Reset and Align
- Recognize and Retain
- Stretch and Grow
Organizations with Succession Planning enabled can also filter and view groups by:
-
Succession Incumbent (Yes/No)
- Defined as a person currently filling a critical role
-
Succession Candidate (Yes/No)
- Defined as a person associated with a critical role, not currently assigned to a critical role but could be in the future
Note: Only users with the Succession role can view or filter by these demographics. Focused Admins or users without the Succession role will not see these options.
Click Export Employee List to export a CSV file with the included employees and more information, learn more.
The Retention Radar aims to identify pockets of risk as precisely as possible to enable admins to make targeted efforts to counteract flight risk.
Group Overview
The Group Overview column indicates the number of employees currently in the group, the number of those who have an up-to-date flight risk calculation, and recent termination data related to the group.
This column highlights the percentage of employees in the group who currently signal high risk according to our flight risk model. For groups where risk is extremely high, we show an icon rather than a percentage, indicating that there is "Extremely High Risk" in the group.
The Turnover Data box provides a rolling view of employee exits for the group, showing trends across time without resetting at the start of a new calendar year.
Turnover data includes exits from the last four complete quarters, plus the current quarter to date, allowing you to consistently evaluate turnover patterns regardless of when you are viewing the report.
The Turnover Data box includes:
-
Total exited employees
-
Total voluntary exits
-
Total involuntary exits
-
The percentage of exited employees who were identified as high flight risk prior to departure
A quarter-by-quarter chart visualizing this data also makes it easier to spot changes or emerging trends over time.
Exit data reflects employees who matched any given group’s demographics at the time of departure.
Note: The numbers for voluntary and involuntary exits require the demographic, Standard Exit Type. Custom demographics that capture exit-type information will not be reflected in the Retention Radar.
About Flight Risk Calculations
In simple terms, an employee's flight risk is calculated by considering the employee's tenure and their responses to a specific set of survey questions, typically from an Engagement survey.
Quantum Workplace's model uses a logistic regression method that focuses on the most important factors for predicting turnover, which helps make it more accurate and less prone to errors. By leveraging extensive data on terminations and surveys, along with a proven engagement model, we can focus on the strongest predictors of flight risk.
Because flight risk calculations are valid for 12 months, it's recommended to conduct annually recurring Engagement surveys to maintain an up-to-date flight risk calculation. Admins can view surveys contributing to an active Flight Risk signal within Retention Radar.
If Engagement data is available but Flight Risk calculations are not enabled, Retention Radar can be unlocked by contacting your Customer Success Manager.
Topics of Concern are surfaced based on patterns in survey responses that are strongly associated with increased turnover risk, and then Suggested Actions are informed by the employee’s survey responses and identified Topics of Concern.
Topics of Concern
The Topics of Concern column highlights survey questions with lower favorability among the group's demographics, particularly those that significantly differ from your organization's average.
Topics of concern include high-impact items from Engagement or Engagement Follow-up surveys, any survey questions that trend with those high-impact questions featured, and low-scoring Exit survey questions.
Retention Radar is meant to serve as a continuous listening mechanism to enable you to track changing perceptions of groups over time across surveys. Relevant survey results will automatically be added to the Topics of Concern column for each group over time as you collect new survey insights from these groups.
To gather additional insight into topics of concern, click View relevant survey comments to view comments left by the high-risk employees. Learn more about best practices when analyzing comments left by at-risk employees.
Only confidential survey comments are shown and any non-English comments are automatically translated to protect confidentiality. Learn more about the Comments report.
Suggested Actions
The Suggested Actions column provides a list of regularly updating contextual, AI-generated solutions.
The AI-generated solutions are based on survey comments and 1-on-1 comments left by employees in the group that relate to the low-scoring survey questions identified as Topics of Concern. The resulting suggested actions are tailored to address the concerns voiced by the employees about topics that matter most to their engagement and retention.
Assign & Manage Group Owner(s)
As a full admin, assign users as Group Owners of a demographic group to delegate turnover mitigation responsibilities. Owners can post comments for a group to share relevant updates with the full admins.
Click Manage Assignments to view, add, and manage Group Owners.
Group Owners are notified via an in-app and email notification that navigates them to information for their demographic group. Owners have visibility into the group's turnover data but, do not have access to survey comments, the Discover tab, or the employee list. Learn more about Group Owners.
Remove Group
To remove a group from the report:
- Click the group's corresponding ⋮ icon in the top-right corner of the card
- Click Remove Group
Navigate the Discover Tab
Use the Discover tab to add additional groups of interest to the report, or specify your own demographics to create custom groups of interest.
To navigate and understand the Discover tab:
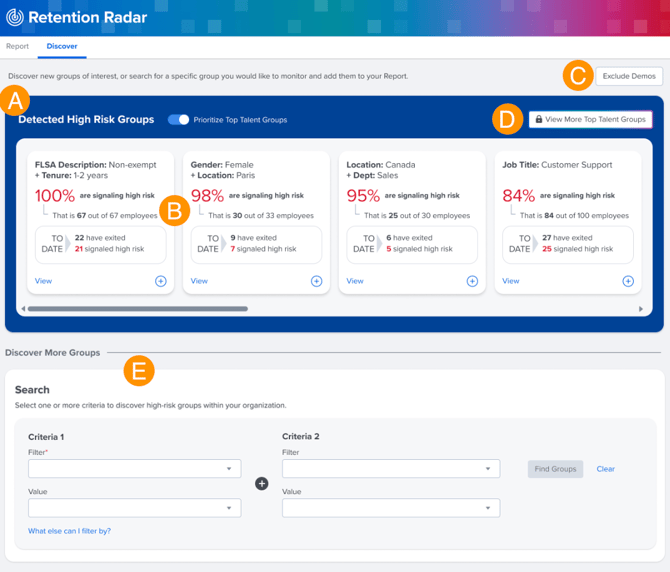
- A. Detected Groups: Scroll through the mini cards for additional demographics identified as high-risk
- B. High-Risk Group: Click View for a specific card to preview a full Group Overview and Topics of Concern for each demographic group
- Click the card's + icon to add the group to your report for ongoing tracking
- C. Exclude Demographics: Click to exclude specific standard and custom demographics from appearing as an automatically detected group, learn more
- D. Top Talent Groups: When available, you can sort Detected High Risk Groups to surface these “Top Talent” groups first, helping you quickly focus on turnover risk among critical employees.
- E. Search: Use the Search by Demographic fields to view the turnover risk data for demographic(s) of your choosing, learn more
Exclude Demographic(s) from Automatic Detection
It may be the case that a known flight risk-associated demographic continues to appear as a Detected High Risk Group and distract from meaningful detections.
In this case, consider excluding a demographic to prevent the specified demographic(s) from being automatically detected and overwhelming the Detected High Risk card. Additionally, for unused demographics, consider archiving the custom demographic.
Excluded demographics remain excluded until manually deselected.

To exclude demographics from appearing as a Detected High Risk Group:
- Click Exclude Demographic to open the Exclude Demographics modal
- Click and expand a demographic category; select and toggle the demographic(s)
- Repeat for each additional excluded demographic
- Click Save
- Repeat steps 1-2 to deselect and include the demographic(s) in the Detected High Risk Group card
Search by Filters
To apply filters for deeper insights into turnover:

- Click Retention Radar in the left-hand navigation menu
- Click and navigate to the Discover tab
- Scroll to the Search section of the page
- Select the criteria (A) and values (B) you'd like to filter by, learn more about the search results based on the completed search fields
- View additional filter options for further analysis (C)
- Click Find Groups (D)
- Click View for a group to view more information or the + icon to add the card to your report
- To search by different demographics, click Clear and repeat steps 5-7
Filter Search Options
Use the drop-down menus for one or both search fields to configure results that can reveal the turnover risk of a specific group. This allows you to view and analyze turnover risk at the deepest level of insight.
Available search criteria options include:
- Department
- Ethnicity
- FSLA
- Gender
- Is Manager
- Level
- Location
- Pay Basis
- Performance Rating (pulls in scores directly from Performance Reviews)
- Tenure
Note: Reviews with Descriptive Scoring enabled will display text-based results in Retention Radar.
Refer to the following to understand how you can use the search fields:
- Specify a Criteria Name and Value for both filters to yield a result with the specified group
- For example, [Name: Generation and Value: GenX] + [Name: Gender and Value: M] returns the data for male Gen X employees
- Specify a Criteria Name and Value for one filter, with the other demographic left blank to yield a result with the specified demographic group, as well as subgroups identified as high-risk
- For example, [Name: Department and Value: Sales] + [Name: _ and Value: _] returns the data for the Sales department, and subgroups, i.e. [Dept: Sales + Generation: GenX], [Dept: Sales + Location: Boston, MA], [Dept: Sales + PTO Taken: 0 Days]
- Specify a Criteria Name and leave the Value blank to yield a result corresponding to the entered Demographic Name
- For example, [Name: Department and Value: _] returns the data for all departments, i.e. Dept: Sales, Dept: Technology, Dept: Marketing, etc.
- Specify a Criteria Name and Value for one field, with only the Criteria Name without a Value for the other field to yield a result for the specified groups with all of the possible values associated with the second Name
- For example, [Name: Department and Value: Sales] + [Name: Location and Value: _] returns the data for the Sales department across all locations, i.e. [Dept: Sales + Location: Omaha], [Dept: Sales + Location: New York City], [Dept: Sales + Location: Boston], etc.
Retention Radar Export
The Export Employee List CSV export includes the names and demographics of active and terminated employees in the group.
Export the Group's Employee List
To export information for a detected group:

- From the Retention Radar's Report tab, identify the at-risk group
- Click Export Employee List
- Open the downloaded CSV file
Overview Tab
Information related to the group's turnover.
Key columns in the Overview tab include, but are not limited to:
- Date of Export
- Number of Employees in Group
- Number of Employees with a Flight Risk Calculation
- % of Employees at Risk
Active Employees Tab
Information related to the demographics of the group's active employees.
Key columns in the Active Employees tab include, but are not limited to:
- Employee Name
- Username
- Job Title
Recent Terminations Tab
Information related to the demographic of the group's recently terminated employees.
Key columns in the Recent Terminations tab include, but are not limited to:
- Employee Name
- Termination Date
- Exit Type
- Job Title
One HR platform for connected talent insights. See how Quantum Workplace brings your data together across 1-on-1s, talent reviews, performance reviews, and more—so you can spot trends, act fast, and make more informed people decisions. Explore the interactive product tour or request a personalized demo with your Customer Success Manager.