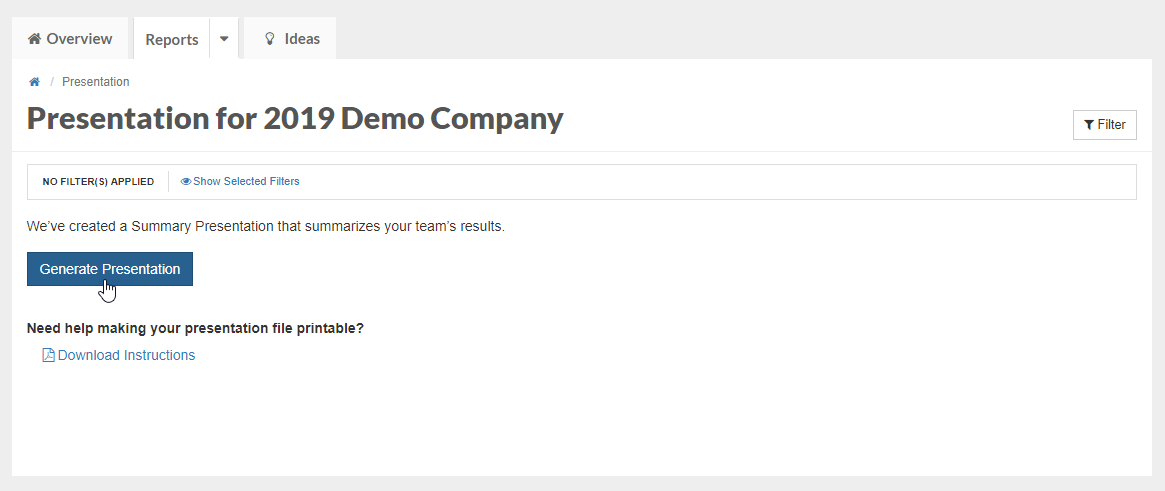
When you first open the Presentation report (accessible via the Reports tab), you will see the option to Generate Presentation.
Your downloaded PowerPoint highlights key data points such as your response rate, overall score, and the most and least favorable questions on your survey (e.g., the questions with the highest and lowest scores on a 6 point agreement scale).