Best Places to Work: NPS (Net Promoter Score)
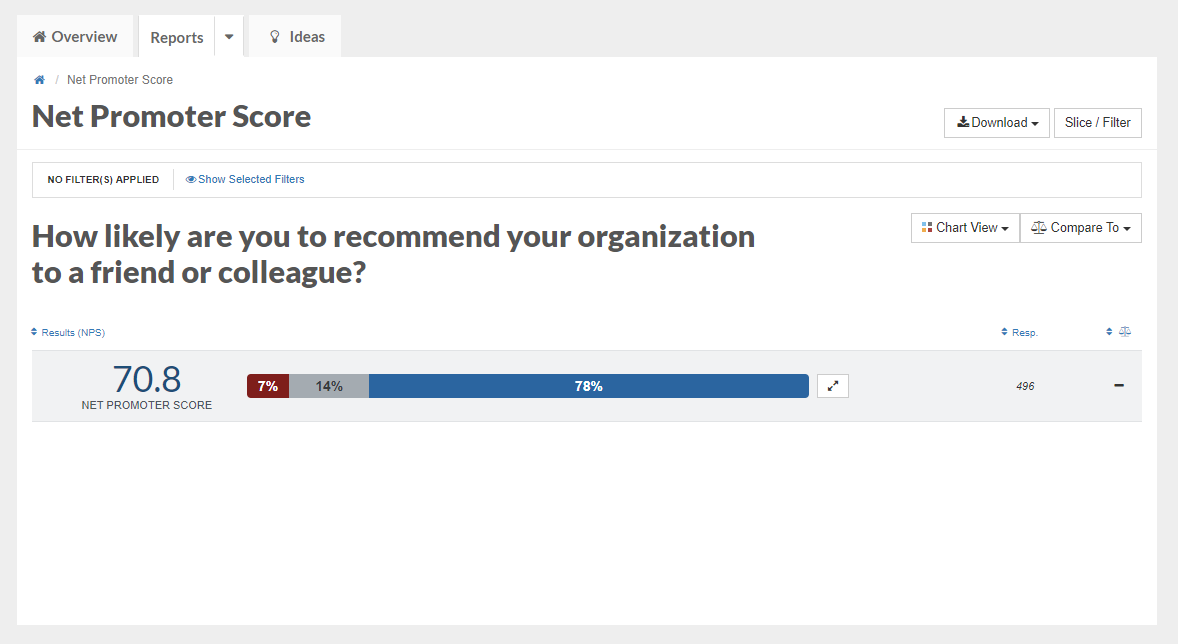
The NPS report displays your organization's responses to the question "How likely are you to recommend your organization to a friend or a colleague?"
The Best Places to Work survey includes the question, "How likely are you to recommend your organization to a friend or colleague?" The responses to that question will appear in the NPS report.

Respondents who select a score of 0-6 are labeled detractors, while respondents who select 7 or 8 are labeled passives. Respondents who select 9 or 10 are promoters of your organization. Your NPS score is calculated by subtracting the percentage of detractors from the percentage of promoters:
NPS = % Promoters - % Detractors
Possible NPS scores range from -100 (if you only have detractors / passive respondents and no promoters) to +100 (if you only have promoters and no detractors or passive respondents). You want your NPS score to be a high, positive number.
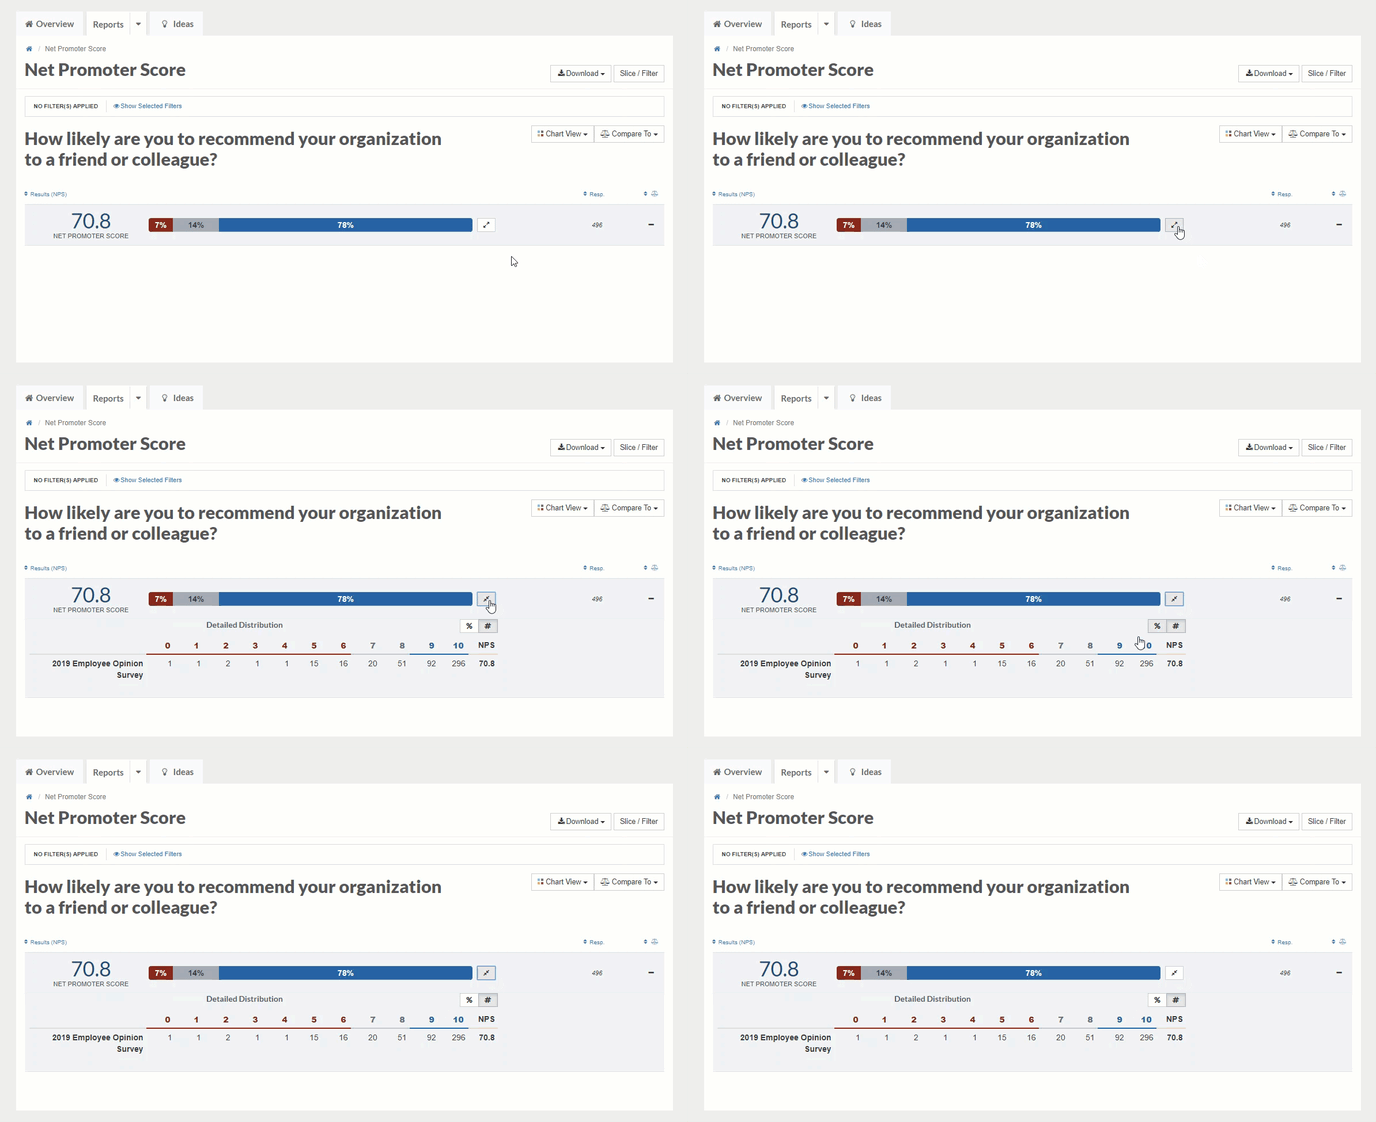
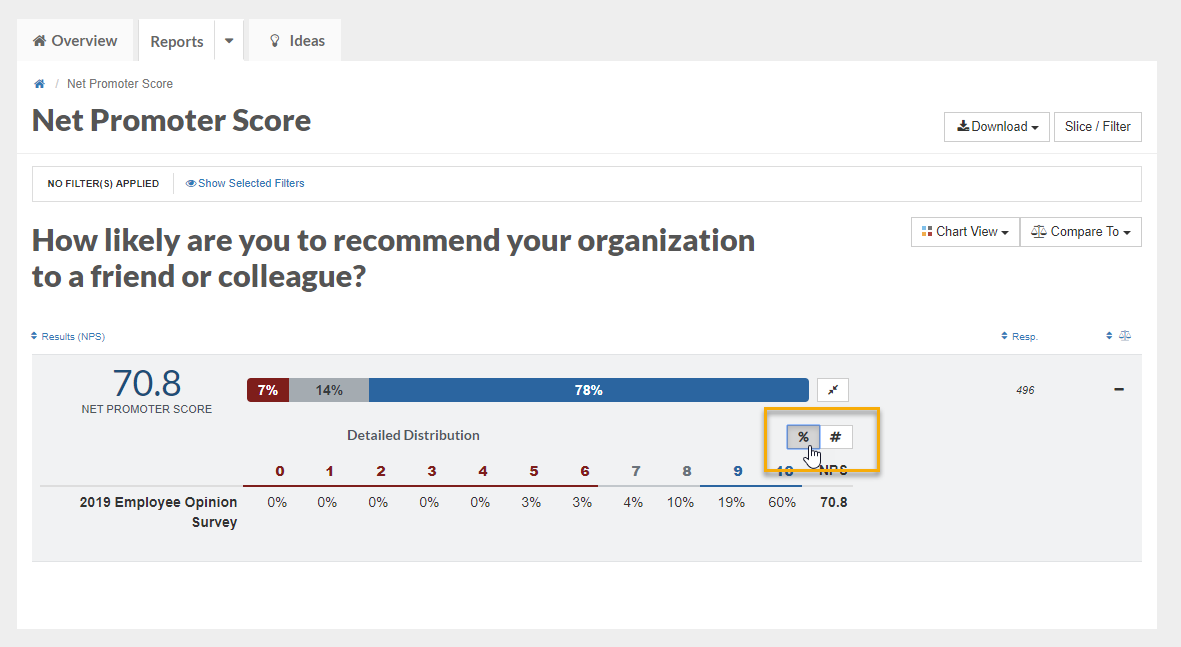
To see the breakout of exactly how employees responded to this question, click the drop expandable arrow:

This view will display the number (or percentage) of employees who responded with each number from 0-10 on this question. You can switch between viewing the number (count) of employees and the percentage of employees who responded this way by clicking the % and # buttons:

