🕐 5 min read to learn about
Featured
NEW! Turnover Dashboards
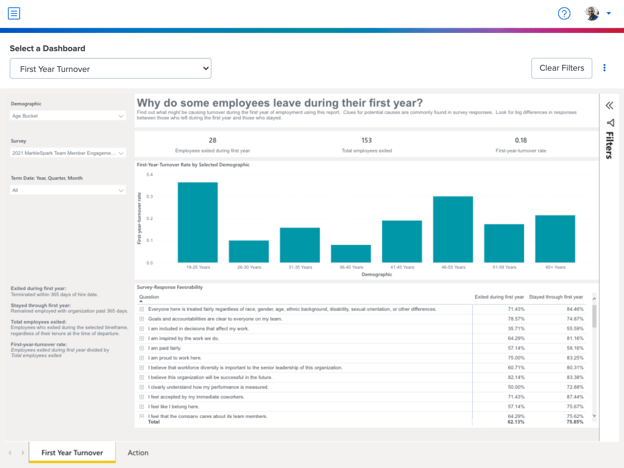
Talent is your biggest asset and greatest lever for success. But interpreting, understanding, and acting on employee feedback can be a challenge. Our new Turnover Dashboards bring together data from across Quantum Workplace to bring critical insight into turnover.
With the Turnover Dashboards you can:
- examine historical turnover data
- mitigate risk with predictive turnover analytics
Turnover Dashboards are included in the software, insight essentials, and insights support packages. If your organization is interested in getting access, request access from your Customer Success Manager.
Once given access, the Turnover Dashboards can be found in the sidebar navigation under Analytics. Select Intelligence Dashboard then navigate to the top drop-down and select the dashboard that you’d like to view.
Learn more about turnover dashboards
NEW! Demographic Intersections
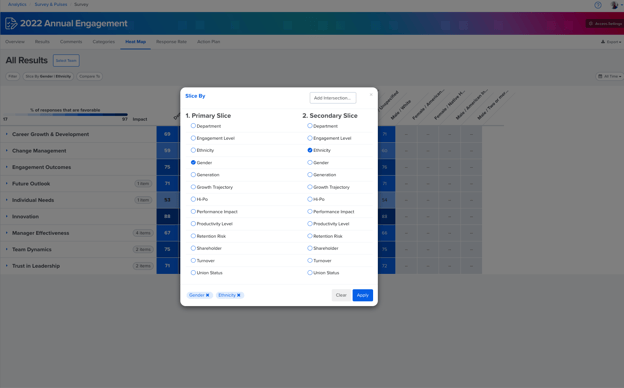
Capture a clear understanding of survey responses between demographics with our new Heat Map enhancement, Intersections.
Intersections make it possible to analyze primary and secondary demographic slices. Prior to intersections, you needed to toggle between demographics. Now you can see multiple demographic slices in an easy-to-interpret Heat Map.
Noteworthy
Improved Accessibility in the Heat Map
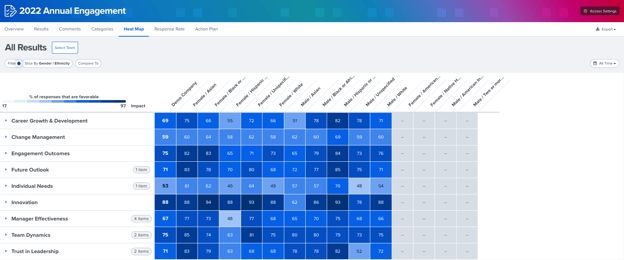
In a modern workplace, ease of use and accessibility is vital to how data is synthesized and shared. Our latest update to the Heat Map brings increased accessibility and clarity to analytics.
The new and improved heat map uses a white-to-blue scale to indicate varying levels of favorability. White indicates lower favorability. Blue indicates higher favorability.
With increased contrast, you can now surface data in a way that is easier to interpret.
Ready to take a look? Navigate to the Heat Map under Survey Analytics. You’ll then have the ability to filter or slice between demographics and the new color scheme will appear.
Gather the same reliable data in a more accessible form with our new and improved Heat Map.
Take Action with 1-on-1 Actions
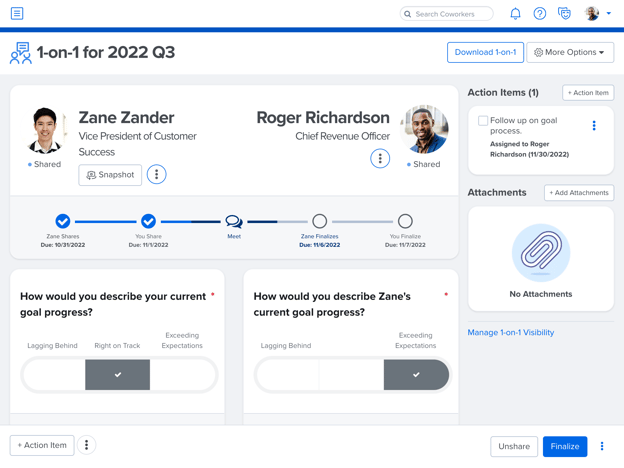
1-on-1s are more than a check-the-box activity, they are continuous opportunities for deep conversation, follow-up, and sharing ideas.
Oftentimes, the same ideas or projects come up during recurring 1-on-1 conversations. Making note of these responsibilities as Action Items keeps them visible and allows for continuous conversation, progress, and most importantly, action.
Ready to make the most of your 1-on-1s? Navigate to 1-on-1s from the sidebar navigation. Select your 1-on-1. After Selecting your 1-on-1, 1-on-1 Actions are located in the top right corner of your browser.
Simply select + Action Item and you can include a description, assignment, and due date.
Select Save Action and the Action will carry throughout your 1-on-1s until it is completed.
Learn more about 1-on-1 Actions
Action Planning Improvements for Surveys
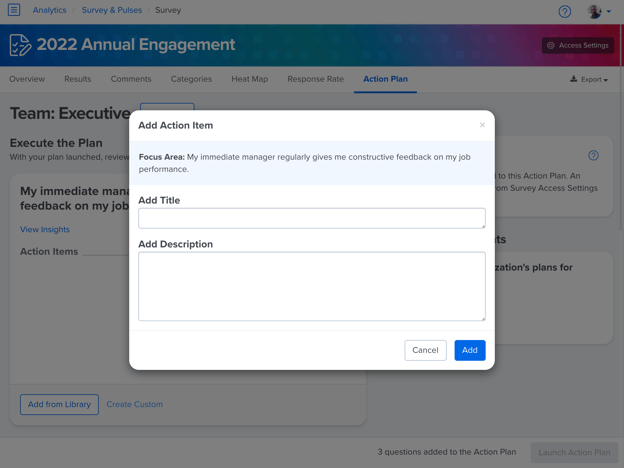
Action doesn’t happen by accident– it requires intentionality and planning to be effective. With our latest improvements to action planning, set your focus areas with fully customizable titles and descriptions.
As soon as you add a focus area, your actions will be live in your action plan without having to launch your plan.
Promote clarity in the areas that matter most with your next action plan.