You'll recall that the survey consists of positive statements such as "I am proud to work here" and that survey takers were asked to rate how well they agree with each statement on a scale from Strongly Disagree to Strongly Agree. Based on how employees respond to the survey, we group them into four different "Engagement Profiles":
- Highly Engaged: average response equals 5 or greater out of 6
Highly engaged employees are strongly connected to their places of work. They are often advocates of the organization who stick with the company through its ups and downs, and make an extra effort to achieve great results. - Moderately Engaged: average response equals 4-4.99 out of 6
Moderately engaged employees are favorable towards the overall workplace experience, but something is holding them back from being highly engaged. - Barely Engaged: average response equals 3-3.99 out of 6
Barely engagedemployees have an indifferent attitude toward their workplace. These employees generally have decreased motivation to perform optimally and are at risk for retention. - Disengaged: average response is less than 3 out 6
Disengaged employees are mentally and emotionally disconnected from their places of work. These employees may be negative and even disruptive with their concerns. Disengaged employees can hinder the productivity of others.
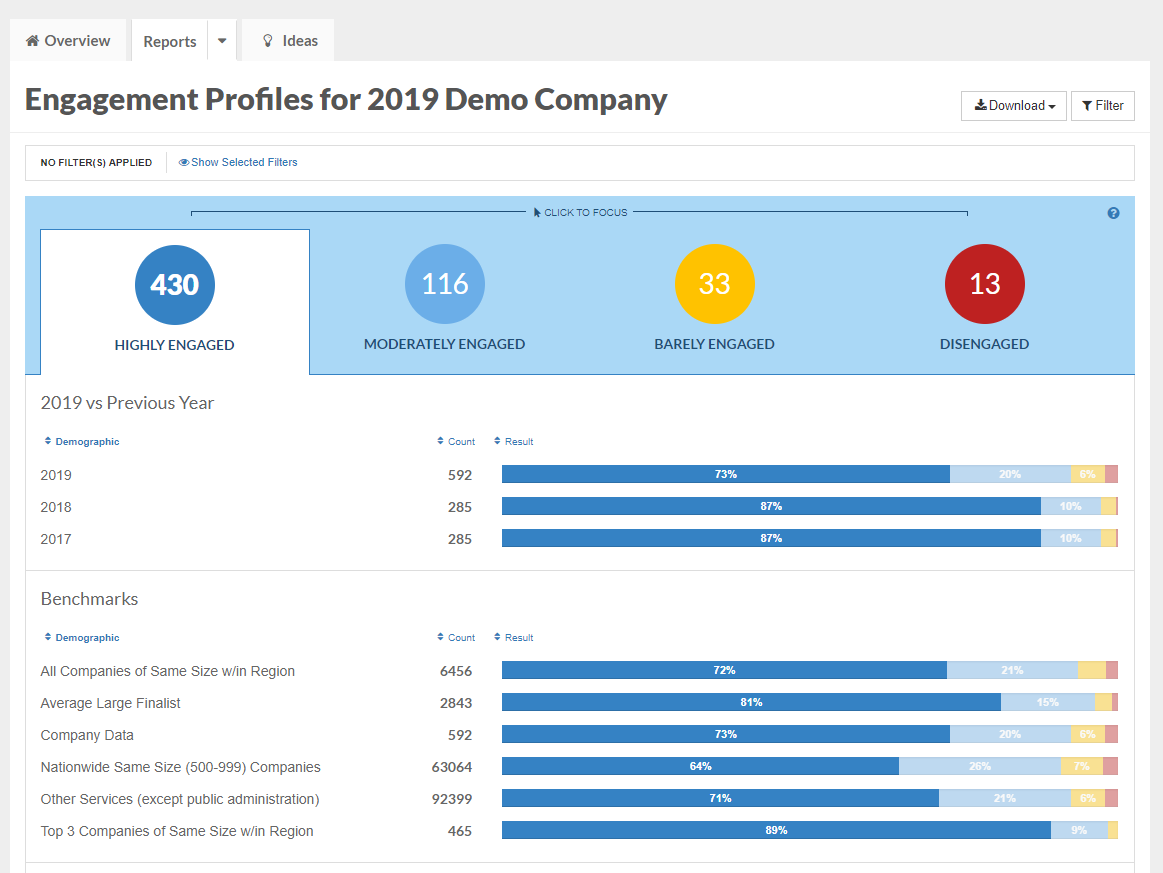
When you first open the Profiles report, you will be able to see the total number of employees in each of these engagement levels at the top of the report. Just below that, you'll be able to see the percentage breakdown of these engagement levels for this year's survey and for prior years if you have participated before. 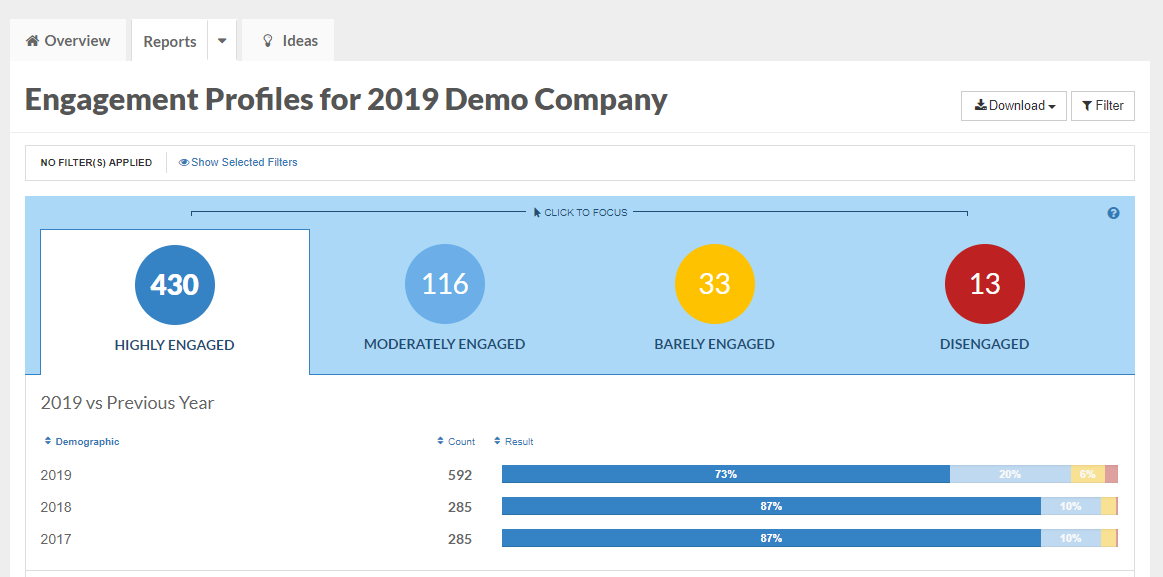
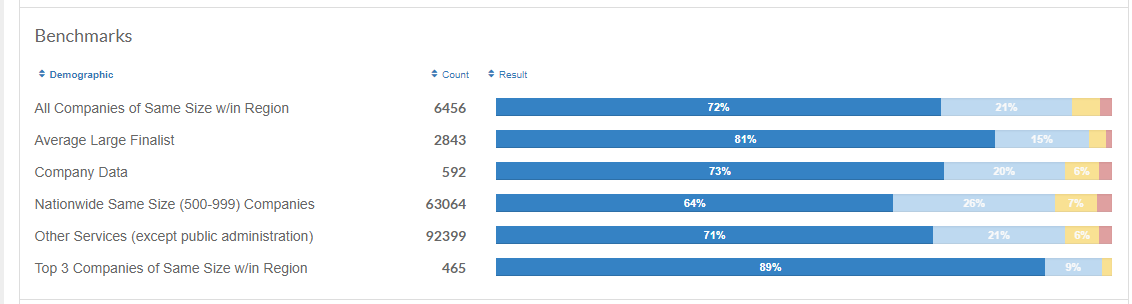
If you scroll down to the Benchmarks section, you'll see a breakout of engagement levels for other companies who participated in the contest on average:
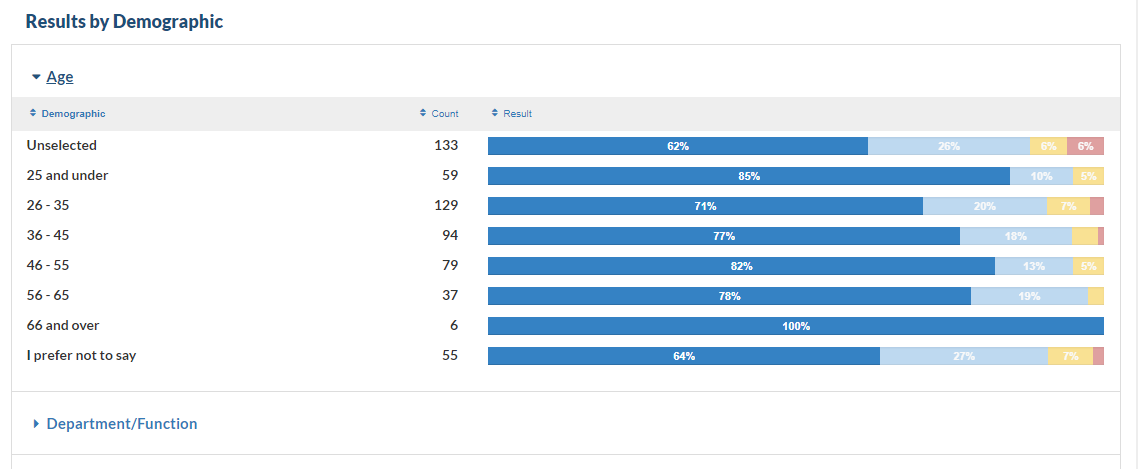
If you scroll further down to the Results by Demographic header, you'll see a breakout engagement levels by various demographics within your organization. Click the drop down arrow next to each demographic to view the percentage breakout of each engagement level for every demographic group.