Add a Meeting Link to 1-on-1s
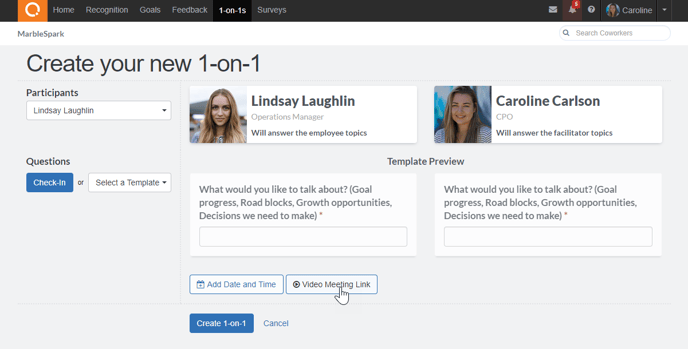
To better accommodate teams who are working remotely during the COVID-19 pandemic, users can now add a link for the video conference room that they will use for their 1-on-1. When initiating their own 1-on-1s, users will click Video Meeting Link to insert the link they'd like to use for their meeting. 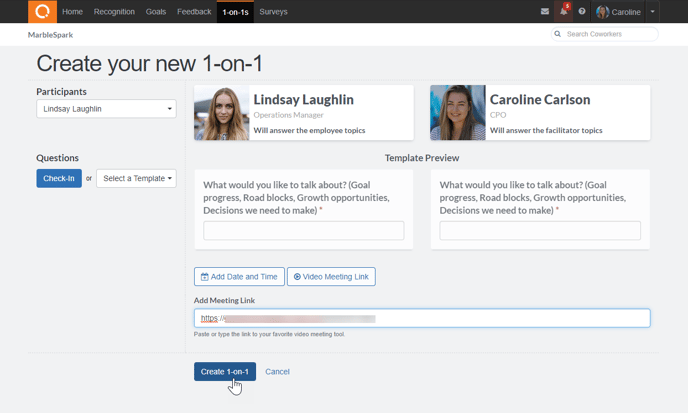
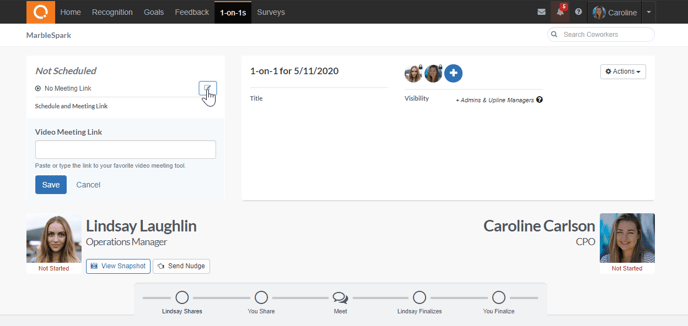
Users can also add a meeting link to a 1-on-1 that was scheduled for them as part of a cycle. To do this, users will open the 1-on-1 and click the edit icon next to No Meeting Link to paste in the link for their meeting. Additionally, users who create their own 1-on-1s but chose not to add a video meeting link when they first created the 1-on-1 can return to the 1-on-1 at any point to add a link using this method.
Once a user has added a link for their online meeting to the 1-on-1, both participants in the 1-on-1 will see the option to join the meeting directly from their 1-on-1s Home Page. Users can click the video icon at the appropriate time to join the meeting. For scheduled 1-on-1s, the meeting link will be added to the calendar invitation. 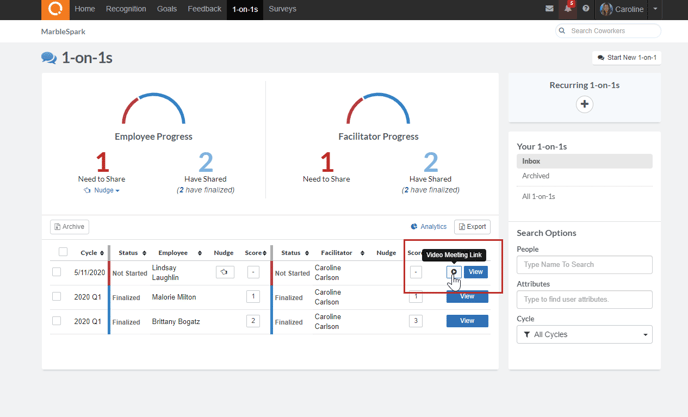
Turnover Rate Analytics Now Available for All Organizations with Exit and Hire Dates
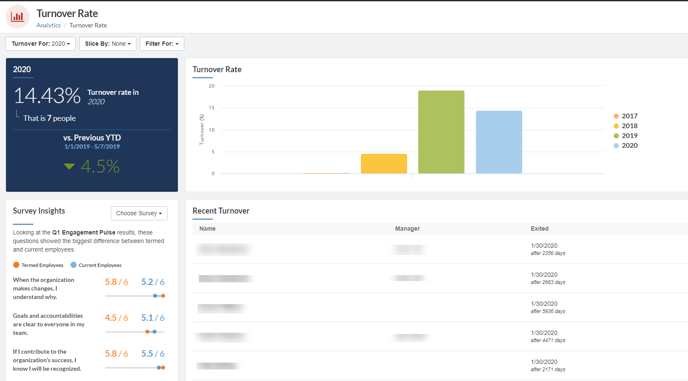
We introduced Turnover Rate Analytics in late 2019 to help organizations track their turnover data in real time and see where turnover is concentrated within the organization. Turnover Rate provides a running list of every employee who has terminated over a given time period as well as their manager, their exit date, and their tenure at the company. You can slice your turnover data by different demographics in your organization to see which departments, managers, and other groups have the highest and lowest turnover.
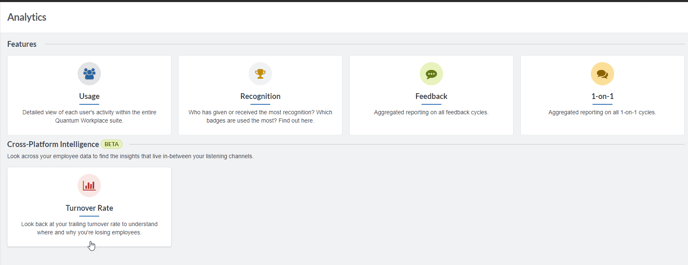
Now Turnover Rate has been turned on for any organization that captures exit and hire dates for employees in Quantum Workplace. You can find it by navigating to Analytics and selecting Turnover Rate.
Do you want to view turnover for your organization, but don’t see any data when you open Turnover Rate in Analytics? Reach out to your Customer Success Manager for assistance.
Highlights: Capture Favorable vs. Unfavorable Responses
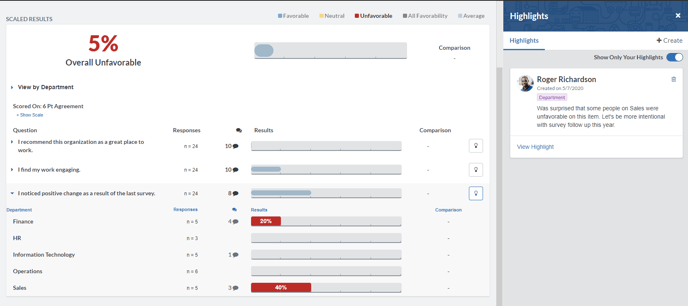
If you’ve launched a survey recently you have probably seen the new Highlights functionality that allows you to bookmark pieces of data that are of interest-- whether that's a particular question on the survey or a filter that shows how a particular department responded to that question. Previously, you could only create highlights that captured the “favorable” data view. Now you can create highlights when looking at the “unfavorable”, “neutral”, “all favorability”, or “average score” view, allowing you to capture more context about your highlights.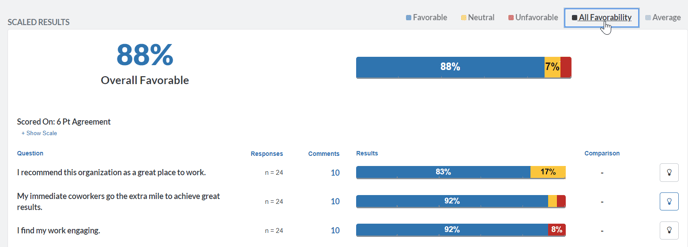
Show only your Highlights
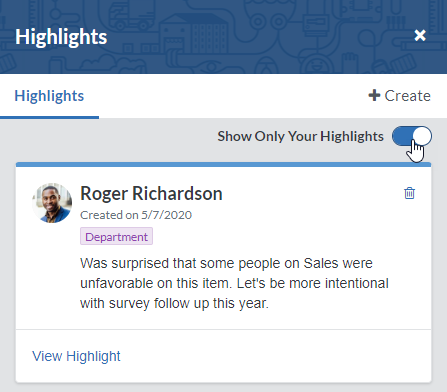
As an Admin, you can see all highlights that have been created for any given survey, whether by other Admin users or by managers who received access to the results for their downline. To better organize your highlights, you’ll see a Show Only Your Highlights toggle that you can switch on to narrow your view to the highlights that you created.