Restrict Visibility into Organizational Goals
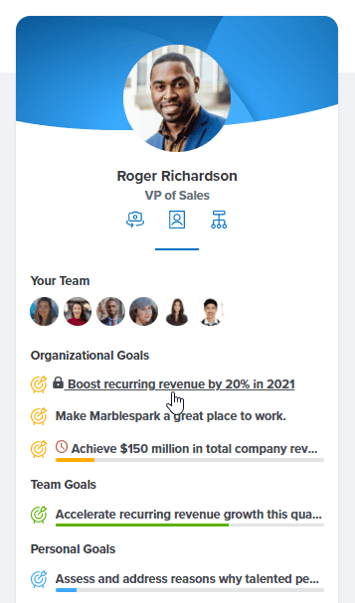
In the past, organizational goals have only been able to be set as “public” goals, which meant that any employee could search for and view the current progress on every organizational goal. However, there are situations when you may want company-wide goals to be confidential. Admin users can now create “restricted” organizational goals, which limits their visibility to Admin users, the goal owner, and anyone who has been added as a contributor or a follower to the goal. Now you can give your senior leadership team members or any key stakeholder visibility into an organizational goal's progress without making that goal visible to your entire company.
Select which Surveys to View Insights for within Turnover Rate
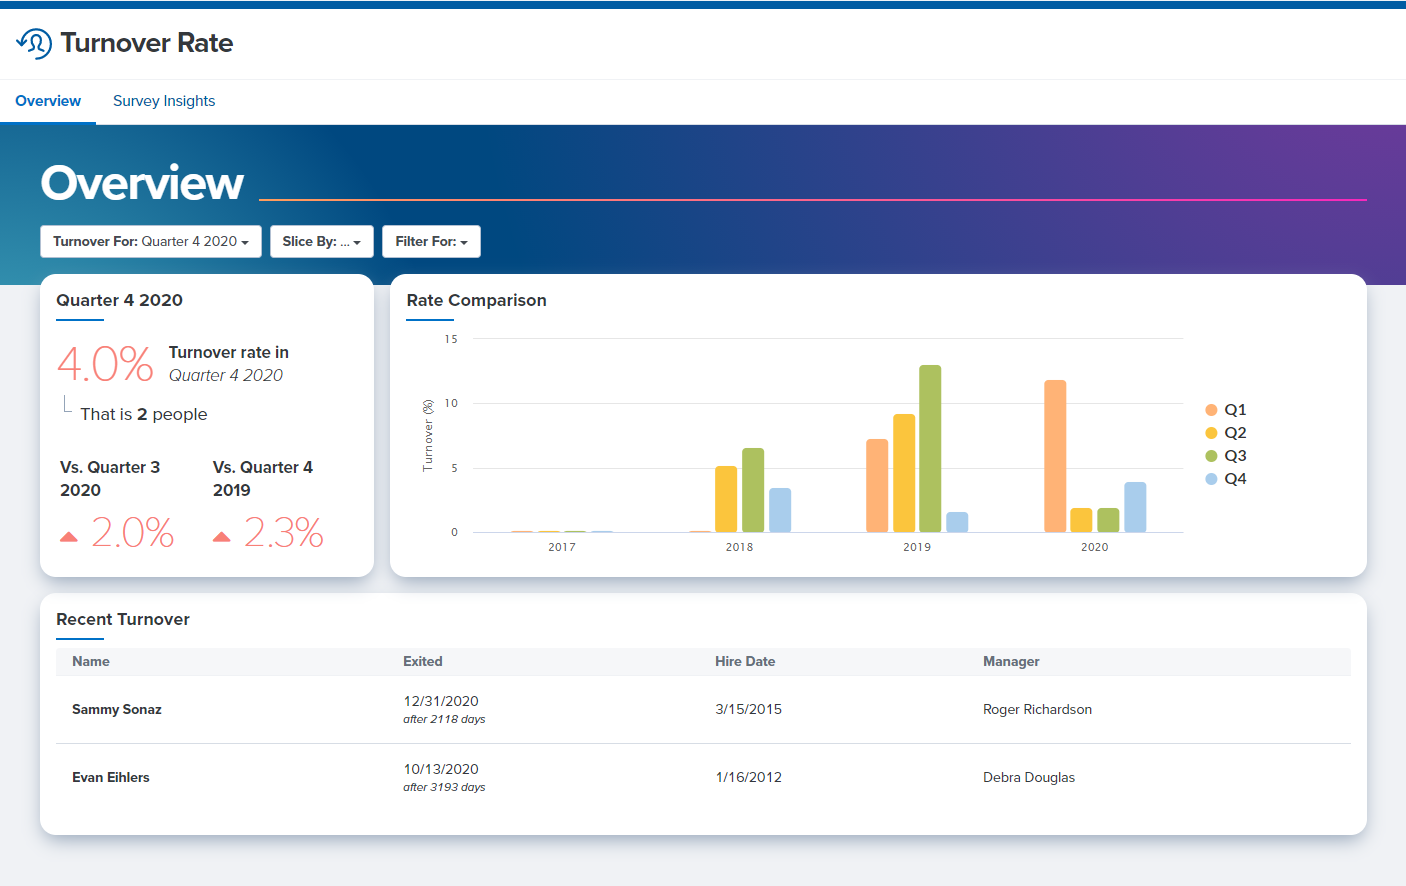
Turnover Rate Analytics provides a dashboard view of your organization’s turnover to help you more easily track turnover trends over time and discern which departments or other groups are most impacted by turnover. Within Turnover Rate Analytics, the Survey Insights section displays the biggest differences in how terminated employees and current employees responded to your recent surveys, which helps illuminate how perceptions may differ between your current employees and those who have terminated.
Previously, the Survey Insights feature displayed results for the three surveys you conducted most recently only. Now you are able to specify exactly which surveys to include in this panel, so that you can choose the most meaningful surveys for comparing results between terminated and current employees. Now, once you click the Survey Insights tab, you will be able to select which surveys you would like to view insights for. You can view the delta for any of the surveys you have conducted that include scaled questions.
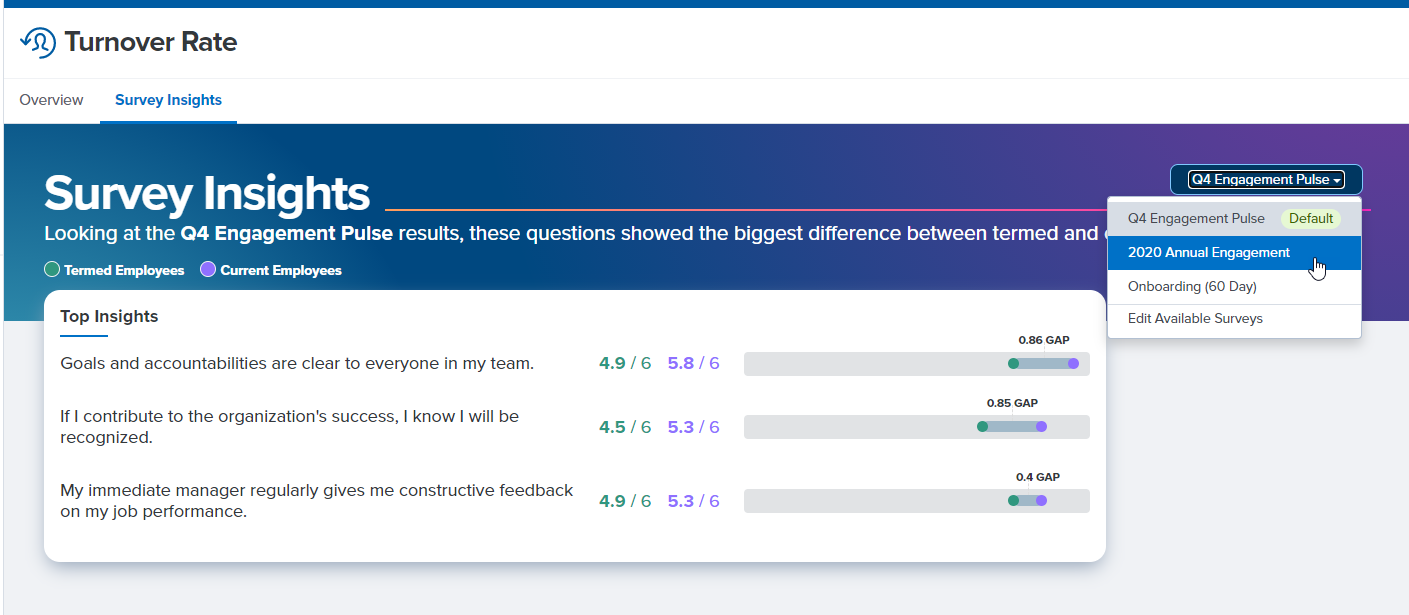
Click here for more instructions on how to view Survey Insights Turnover Rate.
Noteworthy Improvements
Manage Access to Survey Results from One Easy Location
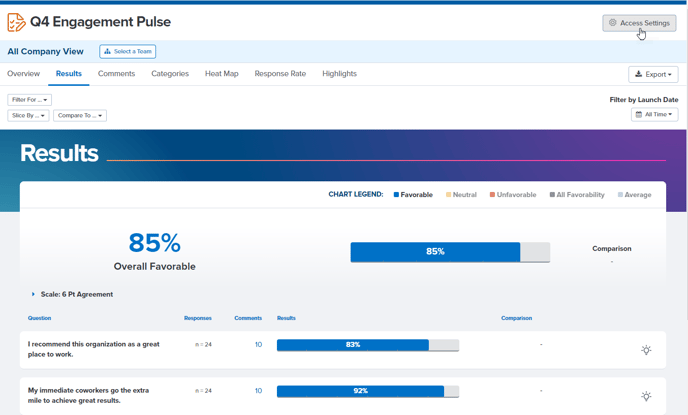
Within Survey Analytics, you'll notice a slight modification to the process of giving your colleagues access to survey results. Now the set up for both Manager Access and Analyst Access live behind the Access Settings button in the top right corner of your Survey Analytics. Click Access Settings to give your colleagues visibility into survey results for either their specific team or for the entire organization.
Faster Impersonation for Focused Admins
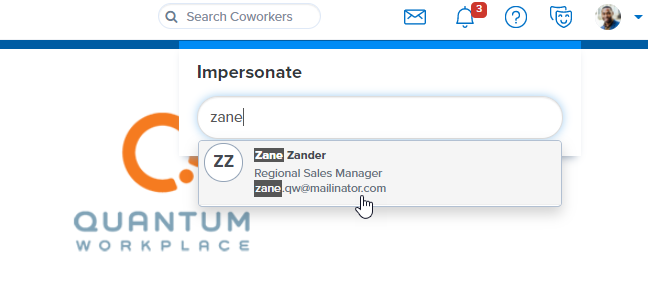
Some Focused Admins were experiencing delays when they attempted to impersonate an employee in their administration scope. We have made some enhancements to make the process of using easy impersonate faster for Focused Admins.
Resending Surveys in Surveys & Pulses
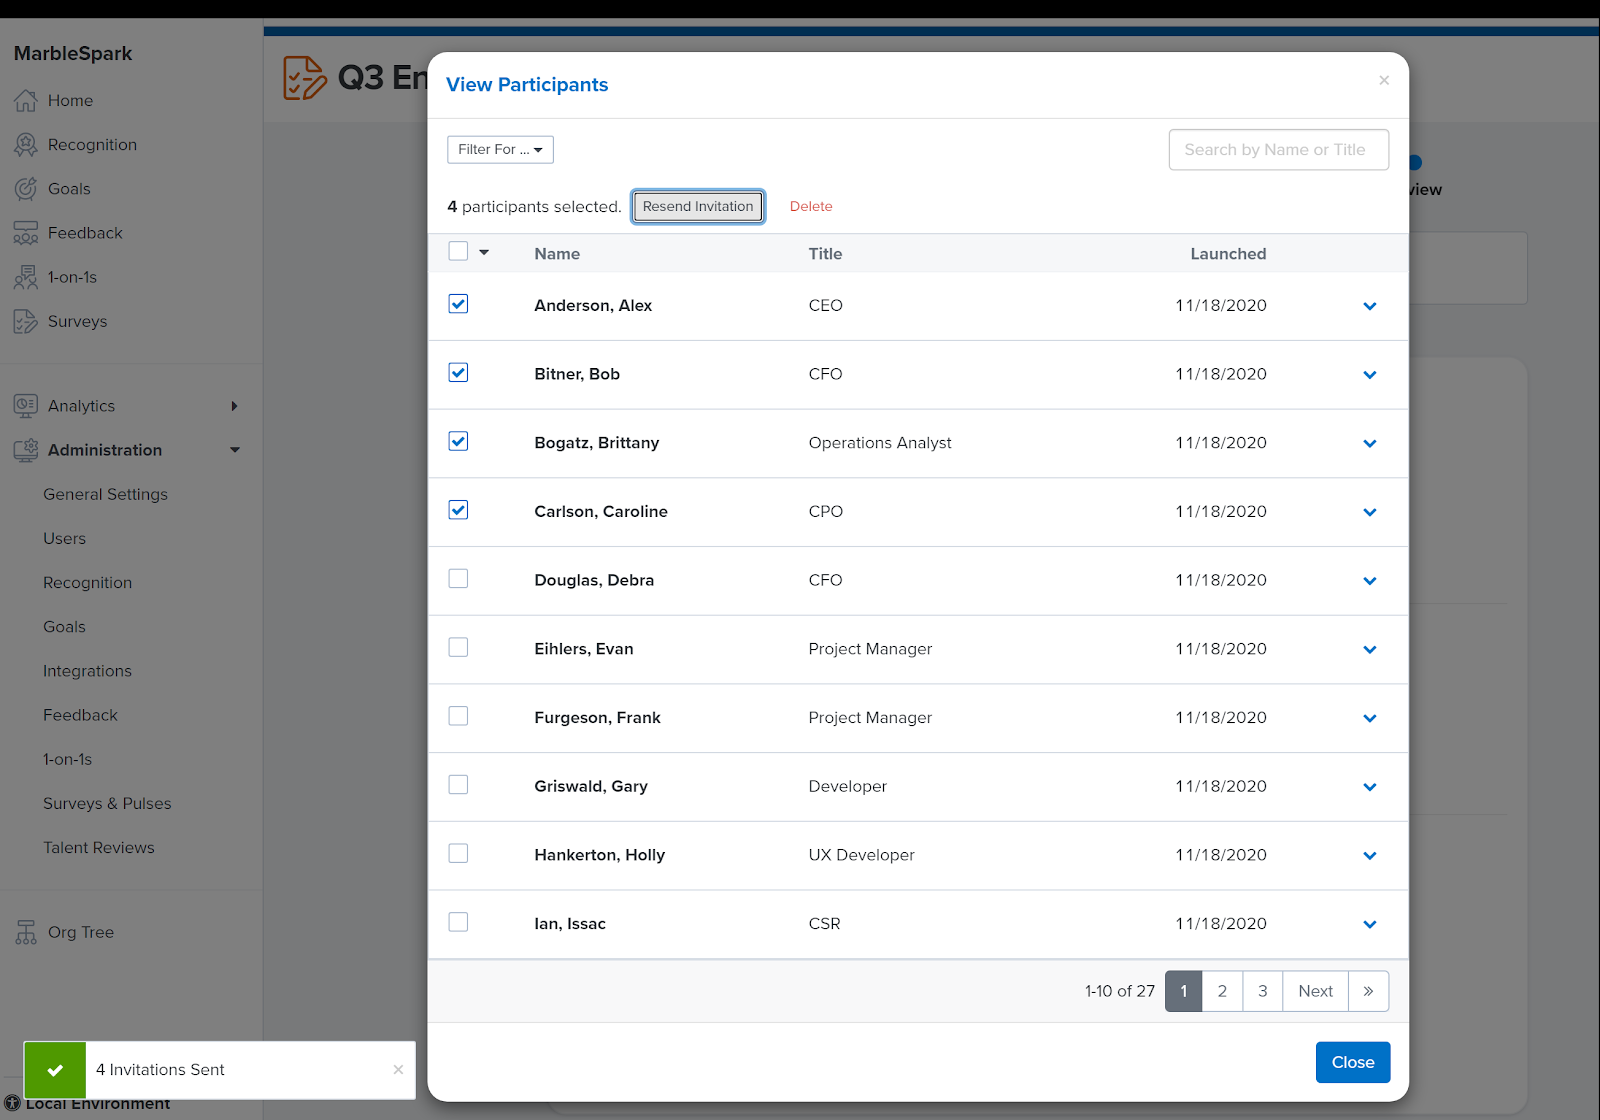
We have heard from customers that it can be dangerously easy to resend a survey invitation to the same employee multiple times accidentally. Going forward, once you resend a survey invitation to one or more employees, you will see a confirmation message indicating the number of survey invitations that you just resent to your employees.
Goals Analytics Export Now Includes Unique Identifiers for Goals
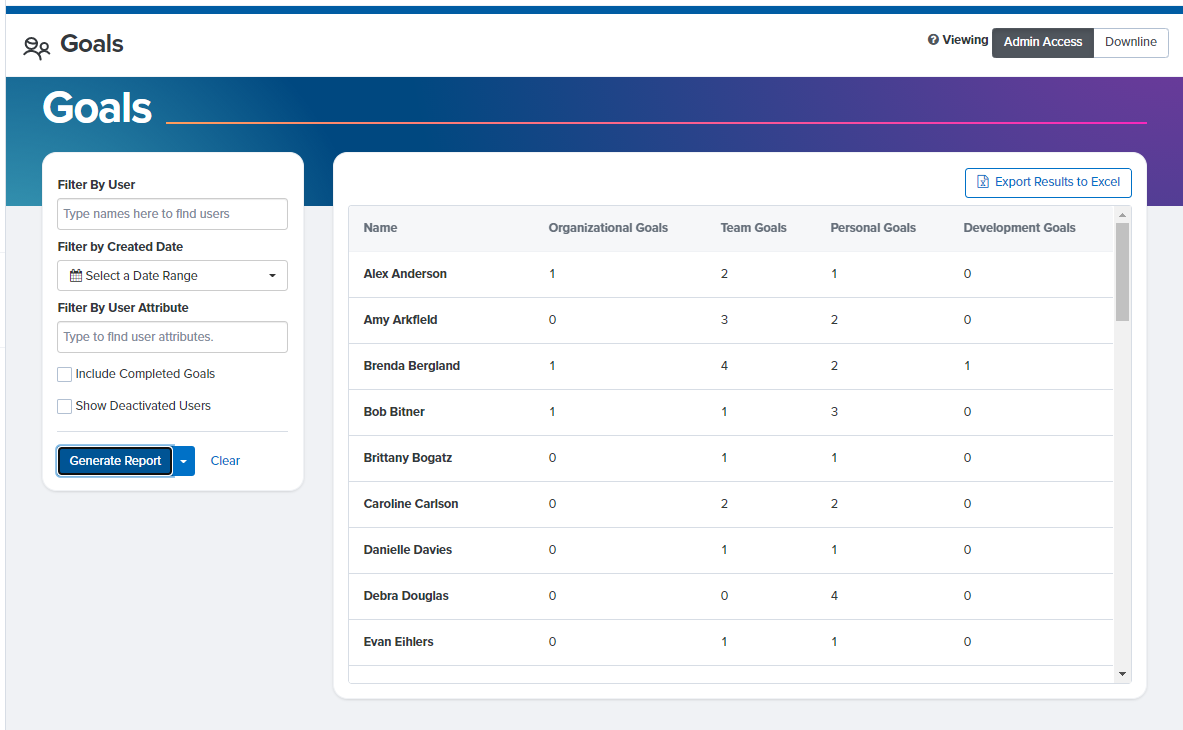
In our most recent product release, we introduced Goals Analytics in BETA. Goals Analytics provides Admins with data about the current progress on all goals throughout the organization and provides managers with data on goals for their downline.
Because multiple employees can be associated with one goal, any goals with contributor(s) or follower(s) will appear in the Goals Analytics export multiple times. To make it easy to filter for unique goals, we have added a Goal ID column to the Goals tab of the Excel export. Every goal that has been created in Quantum Workplace will be assigned its own Goal ID, which will now be included in the Excel export.
Contact your Customer Success Manager to have Goals Analytics enabled for your organization.
Bug Fixes:
Feedback and 1-on-1s Analytics: The Response Rate report within Feedback and 1-on-1s Analytics both incorrectly displayed “Slice By” and “Compare To” buttons that were not functional.
Survey Analytics: We fixed a formatting error in the Categories report that was causing survey items to appear misaligned below their respective categories.