June 28, 2022 - Release Notes
Compare response rates across surveys, Identify org tree branches that can be viewed in analytics, and New User Interface and Experience for Comparisons
🕐 5 min read to learn about
- Compare response rates across surveys
- Identify org tree branches that can be viewed in analytics
- New User Interface and Experience for Comparisons
Compare Response Rates Across Surveys
.png?width=624&name=analytics.stage.quantumworkplace.com_Surveys_View_11877(iPad%20Air).png)
We’ve made it easier to understand and interpret response rates across multiple comparisons. Simply select any comparison from the compare to dropdown and the data from the comparisons will populate in the table below. Response rate comparisons are also available in our PDF and .xlsx exports.
Learn more about response rate comparisons
Noteworthy
Identify Org Tree Branches that can be Viewed in Analytics
.png?width=624&name=analytics.stage.quantumworkplace.com_AccessSettings_View_12250(iPad%20Air).png)
For manager and custom org trees, admins can now see the minimum number of responses needed to view analytics when viewing the tree in access settings. Hover over the blue information icon and you’ll see the minimum number of responses needed in order to view the results.
New User Interface and Experience for Comparisons

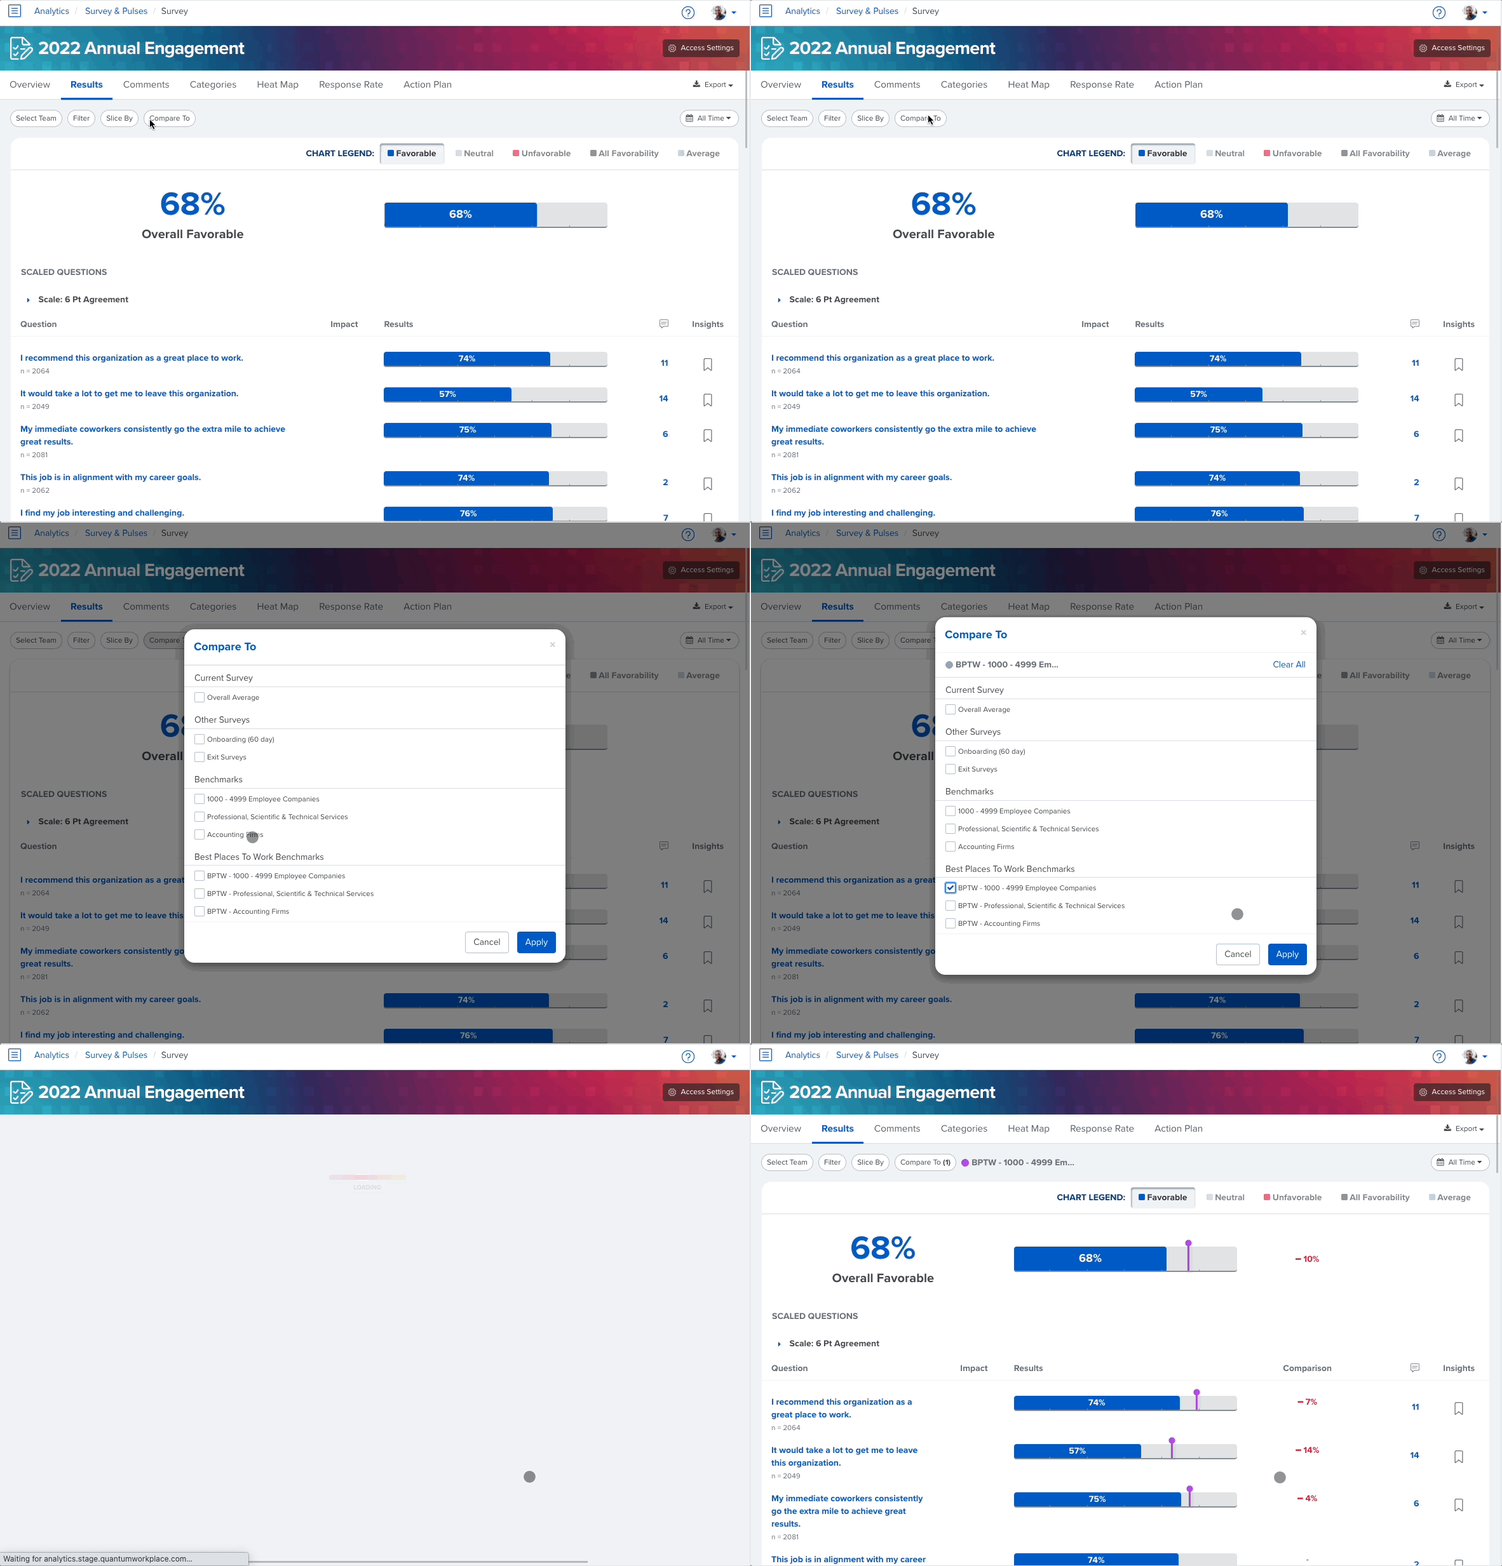
We’ve cleaned up comparisons within our user interface and user experience. When comparisons are unselected, users will not see a comparison column.
Want to see a comparison? Simply select compare to near the navigation, select your comparison, and the comparison column will appear.
