🚀Featured
New Overview Report for Analytics
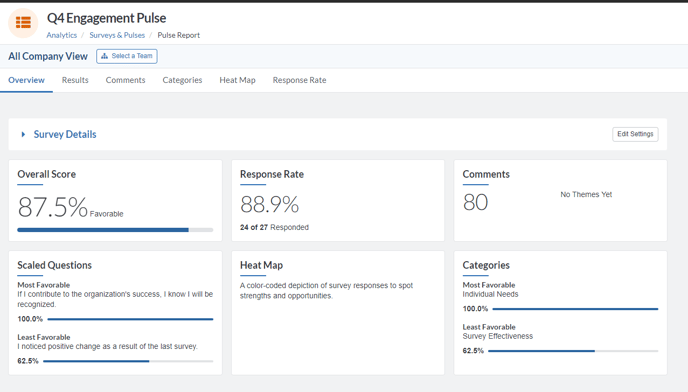
The next time you open Analytics for any given cycle, you’ll notice that the landing page looks a little different. Now when you view Analytics for any non-automated cycle, your landing page will display key data points from your cycle, including the most favorable and least favorable items and categories on your survey. This new landing page, called the Overview report, is available for any non-automated cycle in Pulse, Feedback, and 1-on-1s. The Overview report is not available for either Automated surveys (e.g. lifecycle surveys based on hire and exit date or recurring cycles) or for user-initiated cycles (e.g. Give Feedback).
For Engagement Surveys that are conducted in Pulse, the Overview report contains a high impact analysis that shows you which survey items have the biggest impact on employee engagement in your organization.
Easily View Analytics for a Manager's Downline
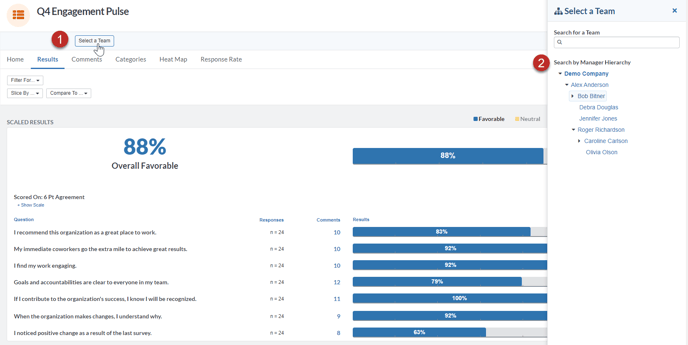
As an Admin viewing survey analytics for your company, you likely keep a close eye on how results vary by team. For all non-automated cycles that you launch going forward, you will be able to easily view results for a manager’s downline using the Select a Team button. This mirrors the functionality of Team Select on your Engagement Survey by displaying your organization’s people leader hierarchy. You can navigate to a specific manager’s level of the organization or simply search for their name to view their results. For past cycles, you will still be able to search for a manager to see their downline, you just won’t have access to this visual manager hierarchy (organization tree.)
📝 Noteworthy
Turnover Rate: Slice and Filter Turnover Data by Manager
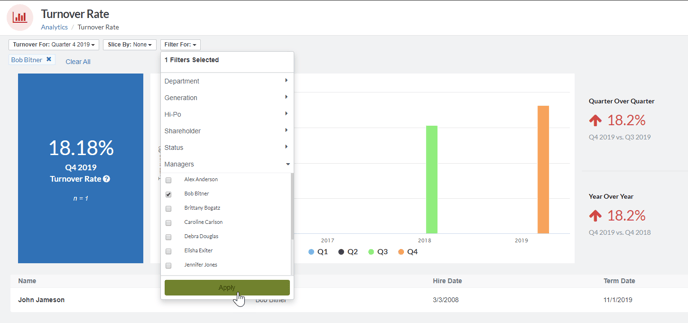
Our newest feature, Turnover Rate, provides data on turnover throughout your organization based on your employee data in Quantum Workplace. You can now slice and filter by immediate manager to see which managers had employees terminate in a given quarter. To open Turnover Rate, navigate to Analytics and select Turnover Rate. From the top left corner, you can click the Slice By button and select Manager to see a graph and table displaying the turnover rate for every manager over the course of a particular quarter- managers who have not had any employees turn over that quarter will have “0” for their number of terms. You can click the Filter For button and select a particular manager’s name to view how many of their direct reports terminated in a given quarter.
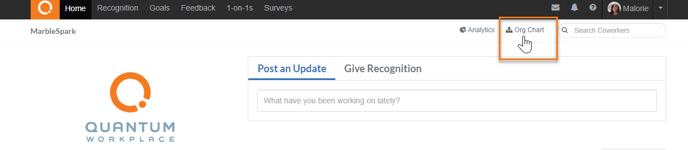
Turn on Org Chart for your Company
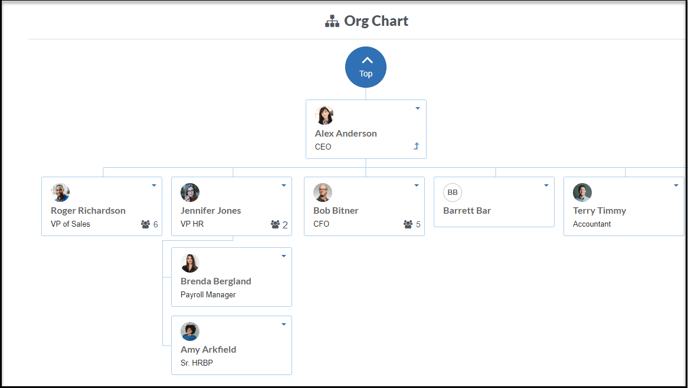
Org Chart is an optional feature that provides your employees with an expandable chart showing the people leader hierarchy in their organization. Once enabled, employees can access the org chart at any time via their secondary navigation bar.
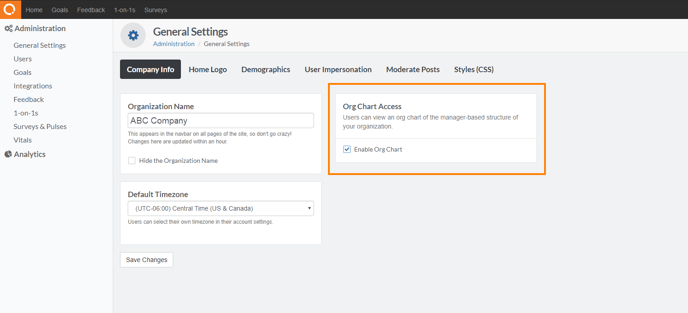
Now Admin users can turn this feature on and off via General Settings in Administration. Under Org Chart access, you can check the box next to Enable Org Chart to turn this feature on for your company.
🔨 Fixed
Launching Draft Goals: Previously, when you launched a draft goal you would need to refresh your screen in order to see that the goal is live. Now users will be able to see that their goal has been launched immediately.