The Categories report functions similarly to the Items report except that it displays average results for every category (e.g. topic) on the survey.
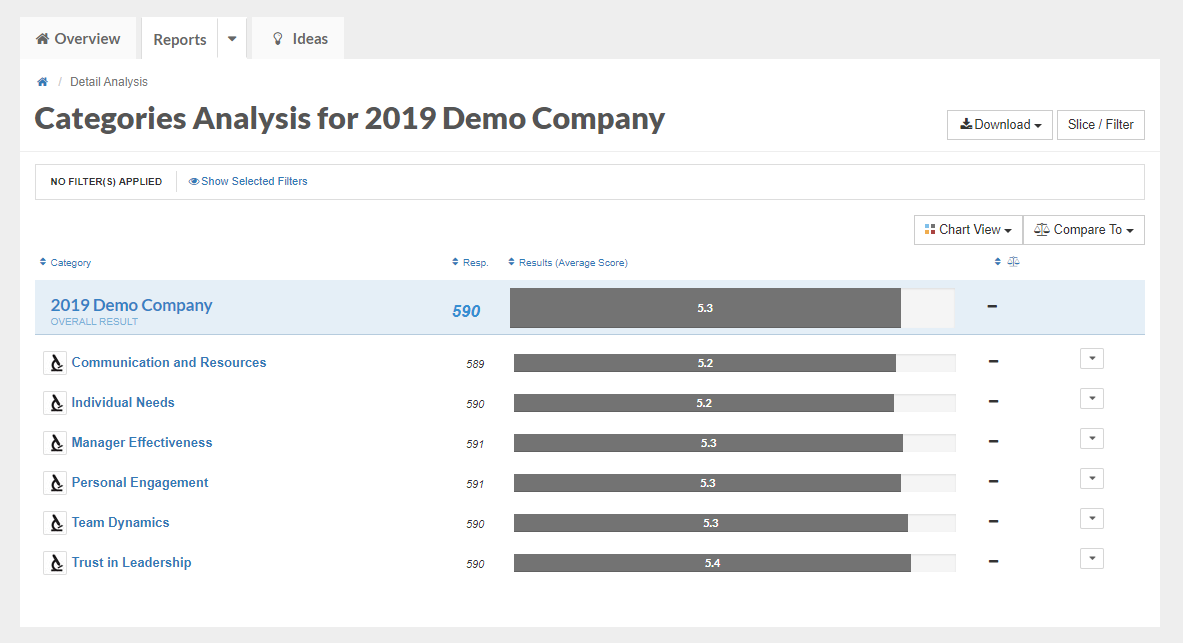
Every individual question on the survey belongs to a particular category. Click on the microscope or the category name to view all survey questions that belong to that category. 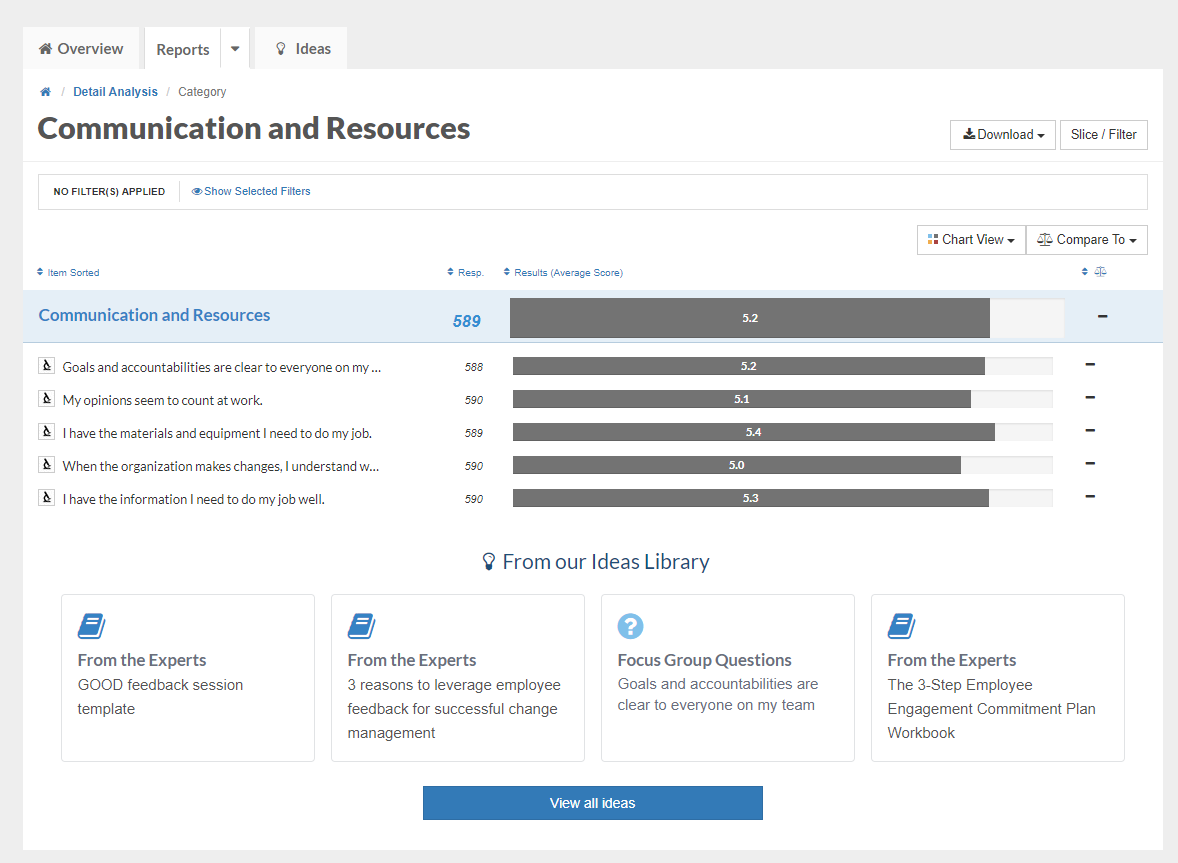
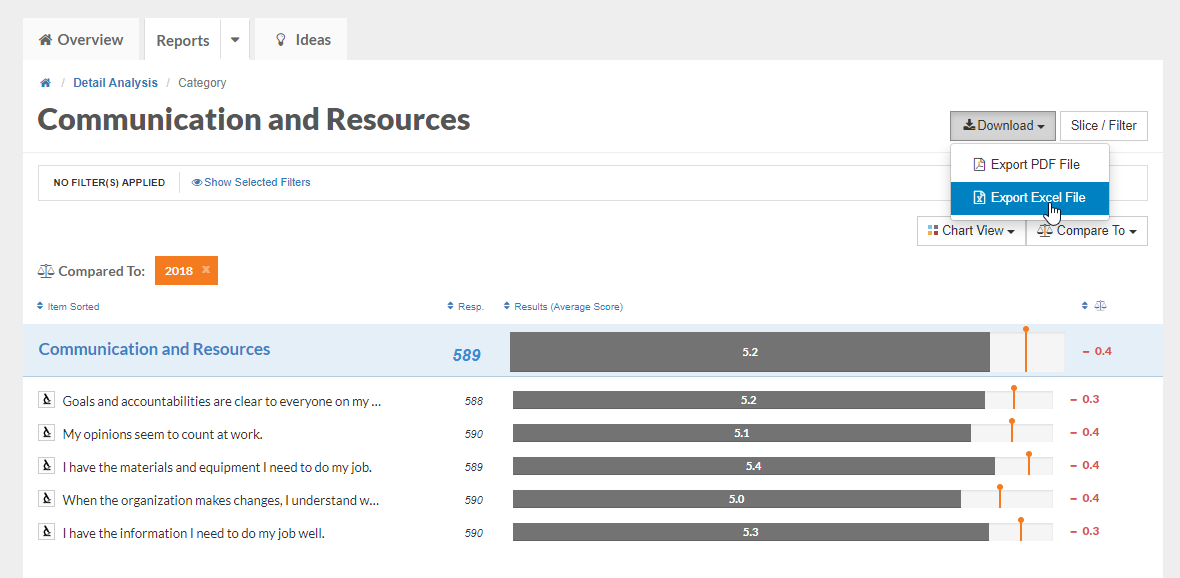
The Categories report includes the same options for Chart View, Slice/Filter, and Compare To as the Ideas Report. Any view you generate of your data (including any slices or filters you've added and any benchmark comparisons) is exportable into PDF or Excel using the Download button.