In this article:
- Overview
- Requirements
- Accessing Feedback Analytics
- Analytics: Useful Information
- Overview Tab
- Results Tab
- Comments Tab
- Confidentiality
Overview
Feedback Analytics can be used to dive into the results and findings of a Feedback cycle. The rest of this article covers how to take advantage of Quantum Workplace's robust analytics for your organization's Feedback cycles.
As an admin, use Analytics to draw insights from roll-up reporting for any given Feedback cycle.
As a manager, view analytics for your downline reports for any given Feedback cycle, where Manager Analytics has been enabled.
Discover more ways to support your team and grow with Quantum Workplace. Explore what's possible.
Requirements
- Available to admins and managers
Accessing Feedback Analytics
To access Feedback Analytics:
.gif?quality=high&width=670&height=326&name=2023-01-03_10-20-42%20(3).gif)
- From the home page, click and expand Analytics in the left-hand navigation menu
- Click Feedback
- Select the Feedback cycle to view its analytics
Analytics: Useful Information
Select Team
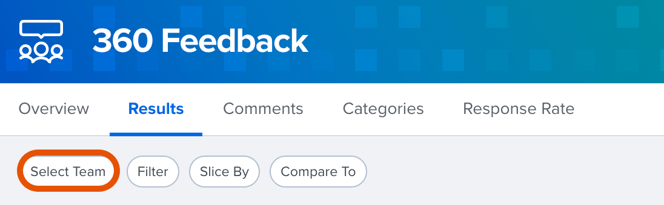
Use the Select Team button to specify which teams to show the results for, e.g. via Manager Org Tree or Custom Org Trees.
Filter, Slice By, and Compare To

- Use the Filter option to select and view the results for the selected demographic
- Use the Slice By option and select and highlight the aspects of a demographic- for example, if you slice by Tenure, in the results you'll notice how different Tenure brackets, i.e. 0-2 years, 3-5 years, etc. responded to a question
- Use the Compare To option to compare the current results against other cycles- active comparisons will be reflected in your results as a pin indicating scores from the compared cycle
Exporting Reports

Any available reports can be exported as a PDF or Excel file. Use the Export drop-down in the top-right corner to export your data.
Any active filters, slices, or comparisons will remain active in the exported reports.
Learn more about exporting Feedback data by template or cycle.
Feedback Cycle Details
View the Feedback cycle details in the Overview tab, in the About this Feedback Cycle section.

- Cycle Info: View participant information, as well as the launch/close date
- Cycle Settings: View the template used, Manager Analytics status, and the minimum number of responses required, for confidentiality reasons
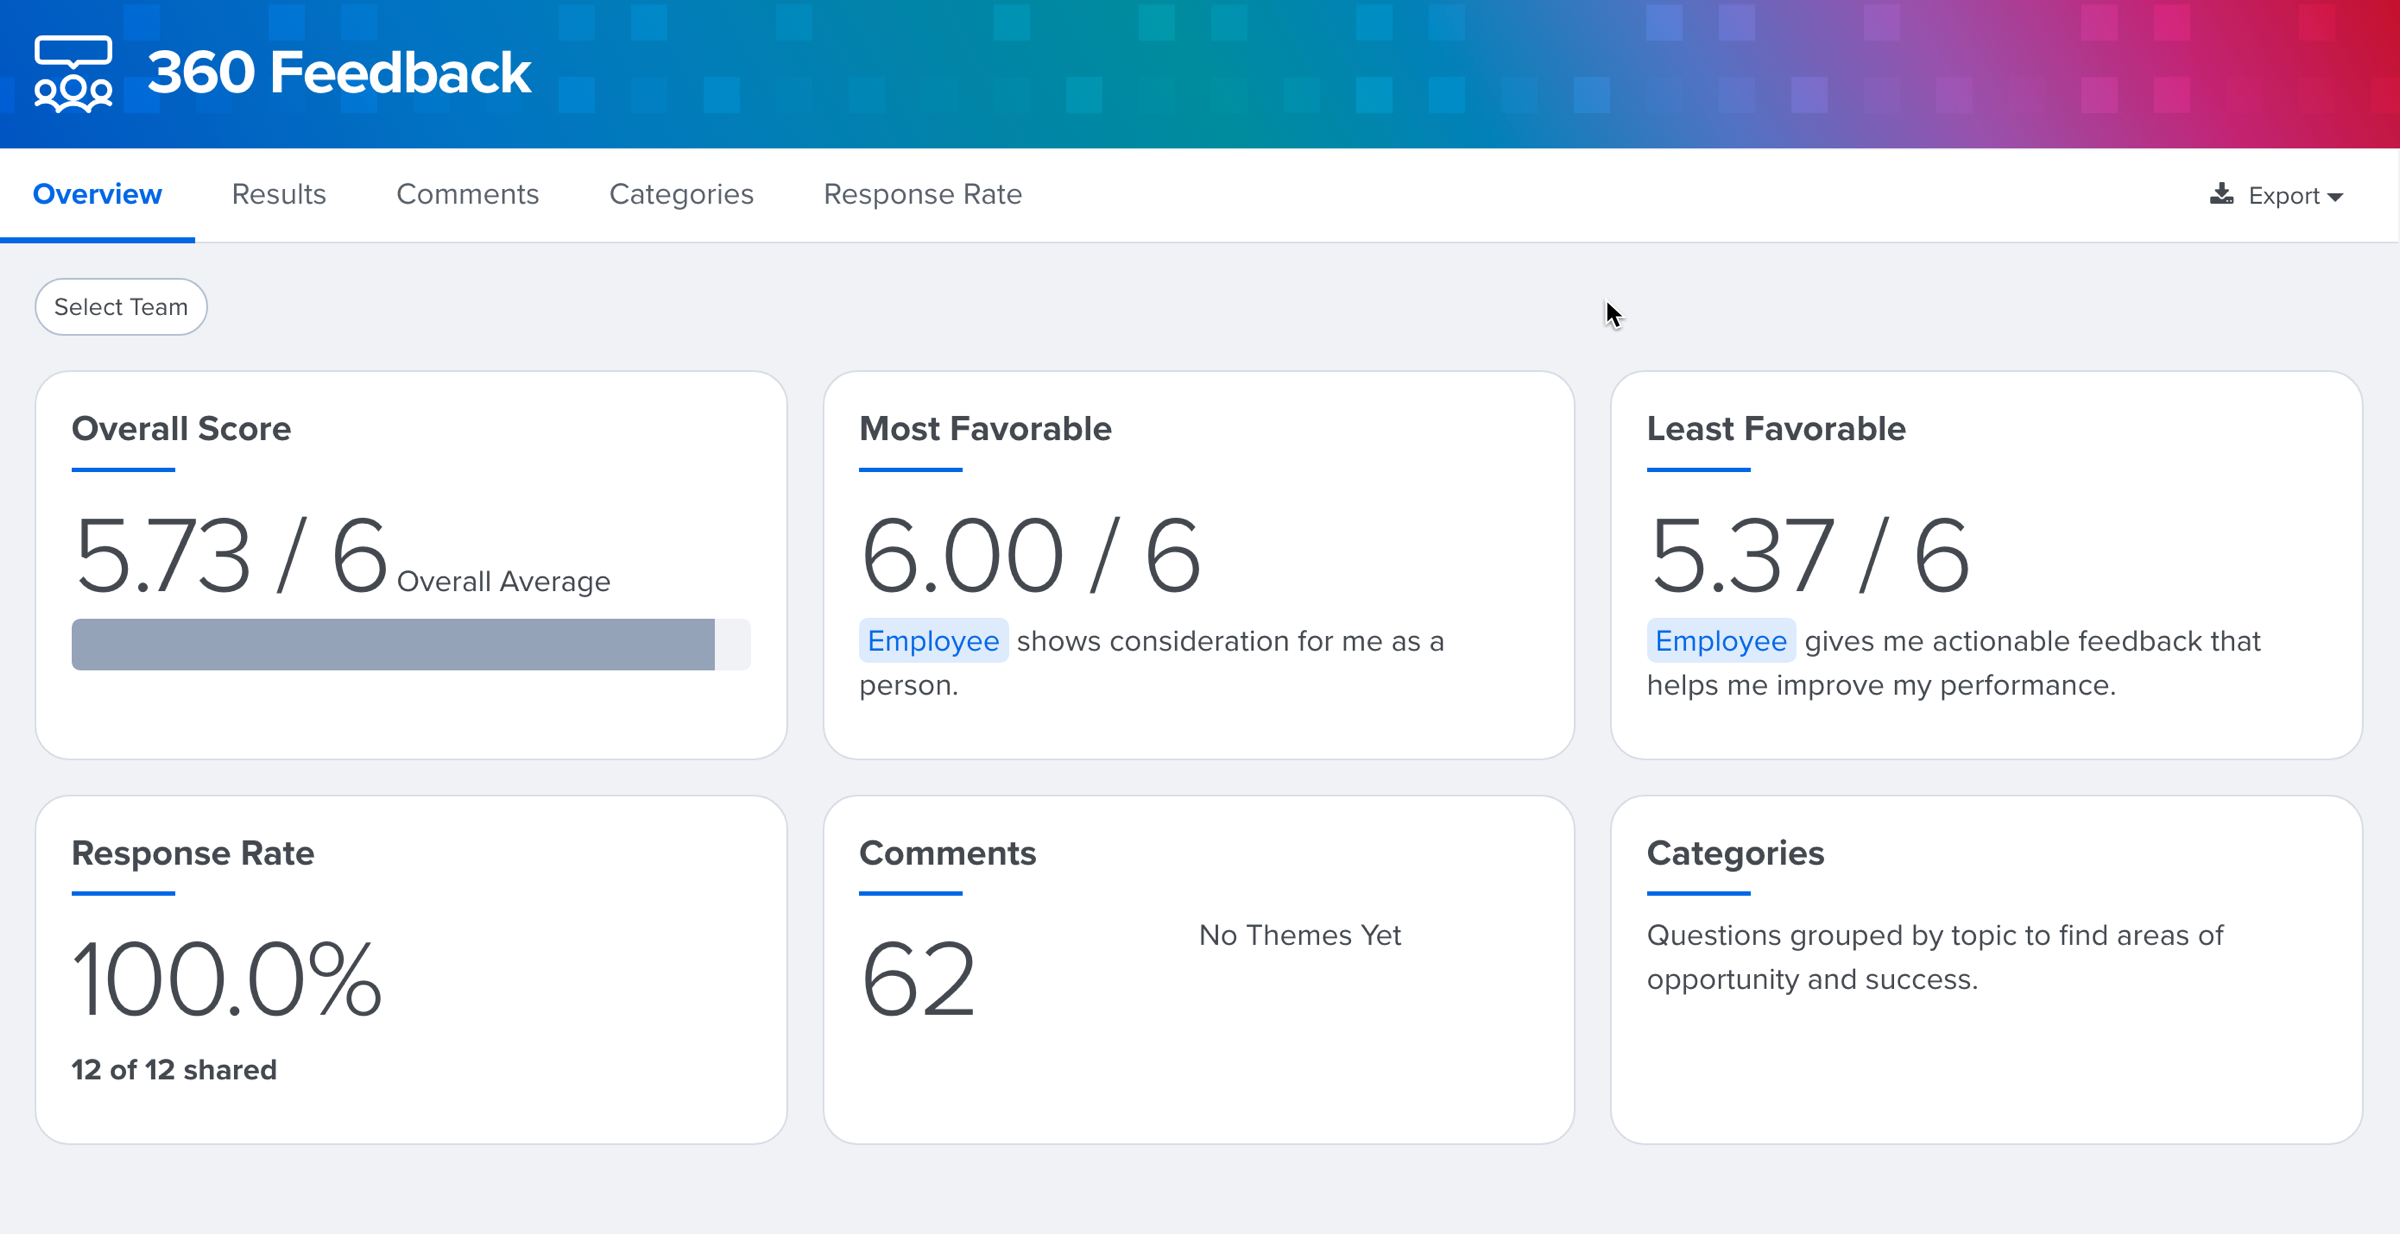
Overview Tab
When viewing analytics for the selected Feedback cycle, you are initially navigated to the Overview tab where you can quickly see a summary of your Feedback results, i.e. overall score, most favorable, response rate, etc.
To view your results in greater detail, click the card to navigate to the respective tab.
Results Tab
The Results tab displays the results for all of the quantitative questions, i.e. scaled agreement, NPS and multi-choice questions.
At the top, an overall average is displayed. This score is averaged across all of the questions in the cycle. If you provide feedback for yourself, i.e. 360 Feedback, a Self Average is displayed alongside the Overall Average score.
Self-reported scores are not included in the Overall Score, self-reported scores are instead displayed separately as the Self Average score.
The rest of the Results tab lists each of the cycle's questions and its respective number of responses, number of comments and the average score.
Feedback Groups allow you to isolate and view results depending on the respondent, i.e. manager, peers, direct reports, etc. Click the Feedback Group to enable/disable their impact.
.gif?quality=high&width=670&height=423&name=2023-01-03_13-07-42%20(1).gif)
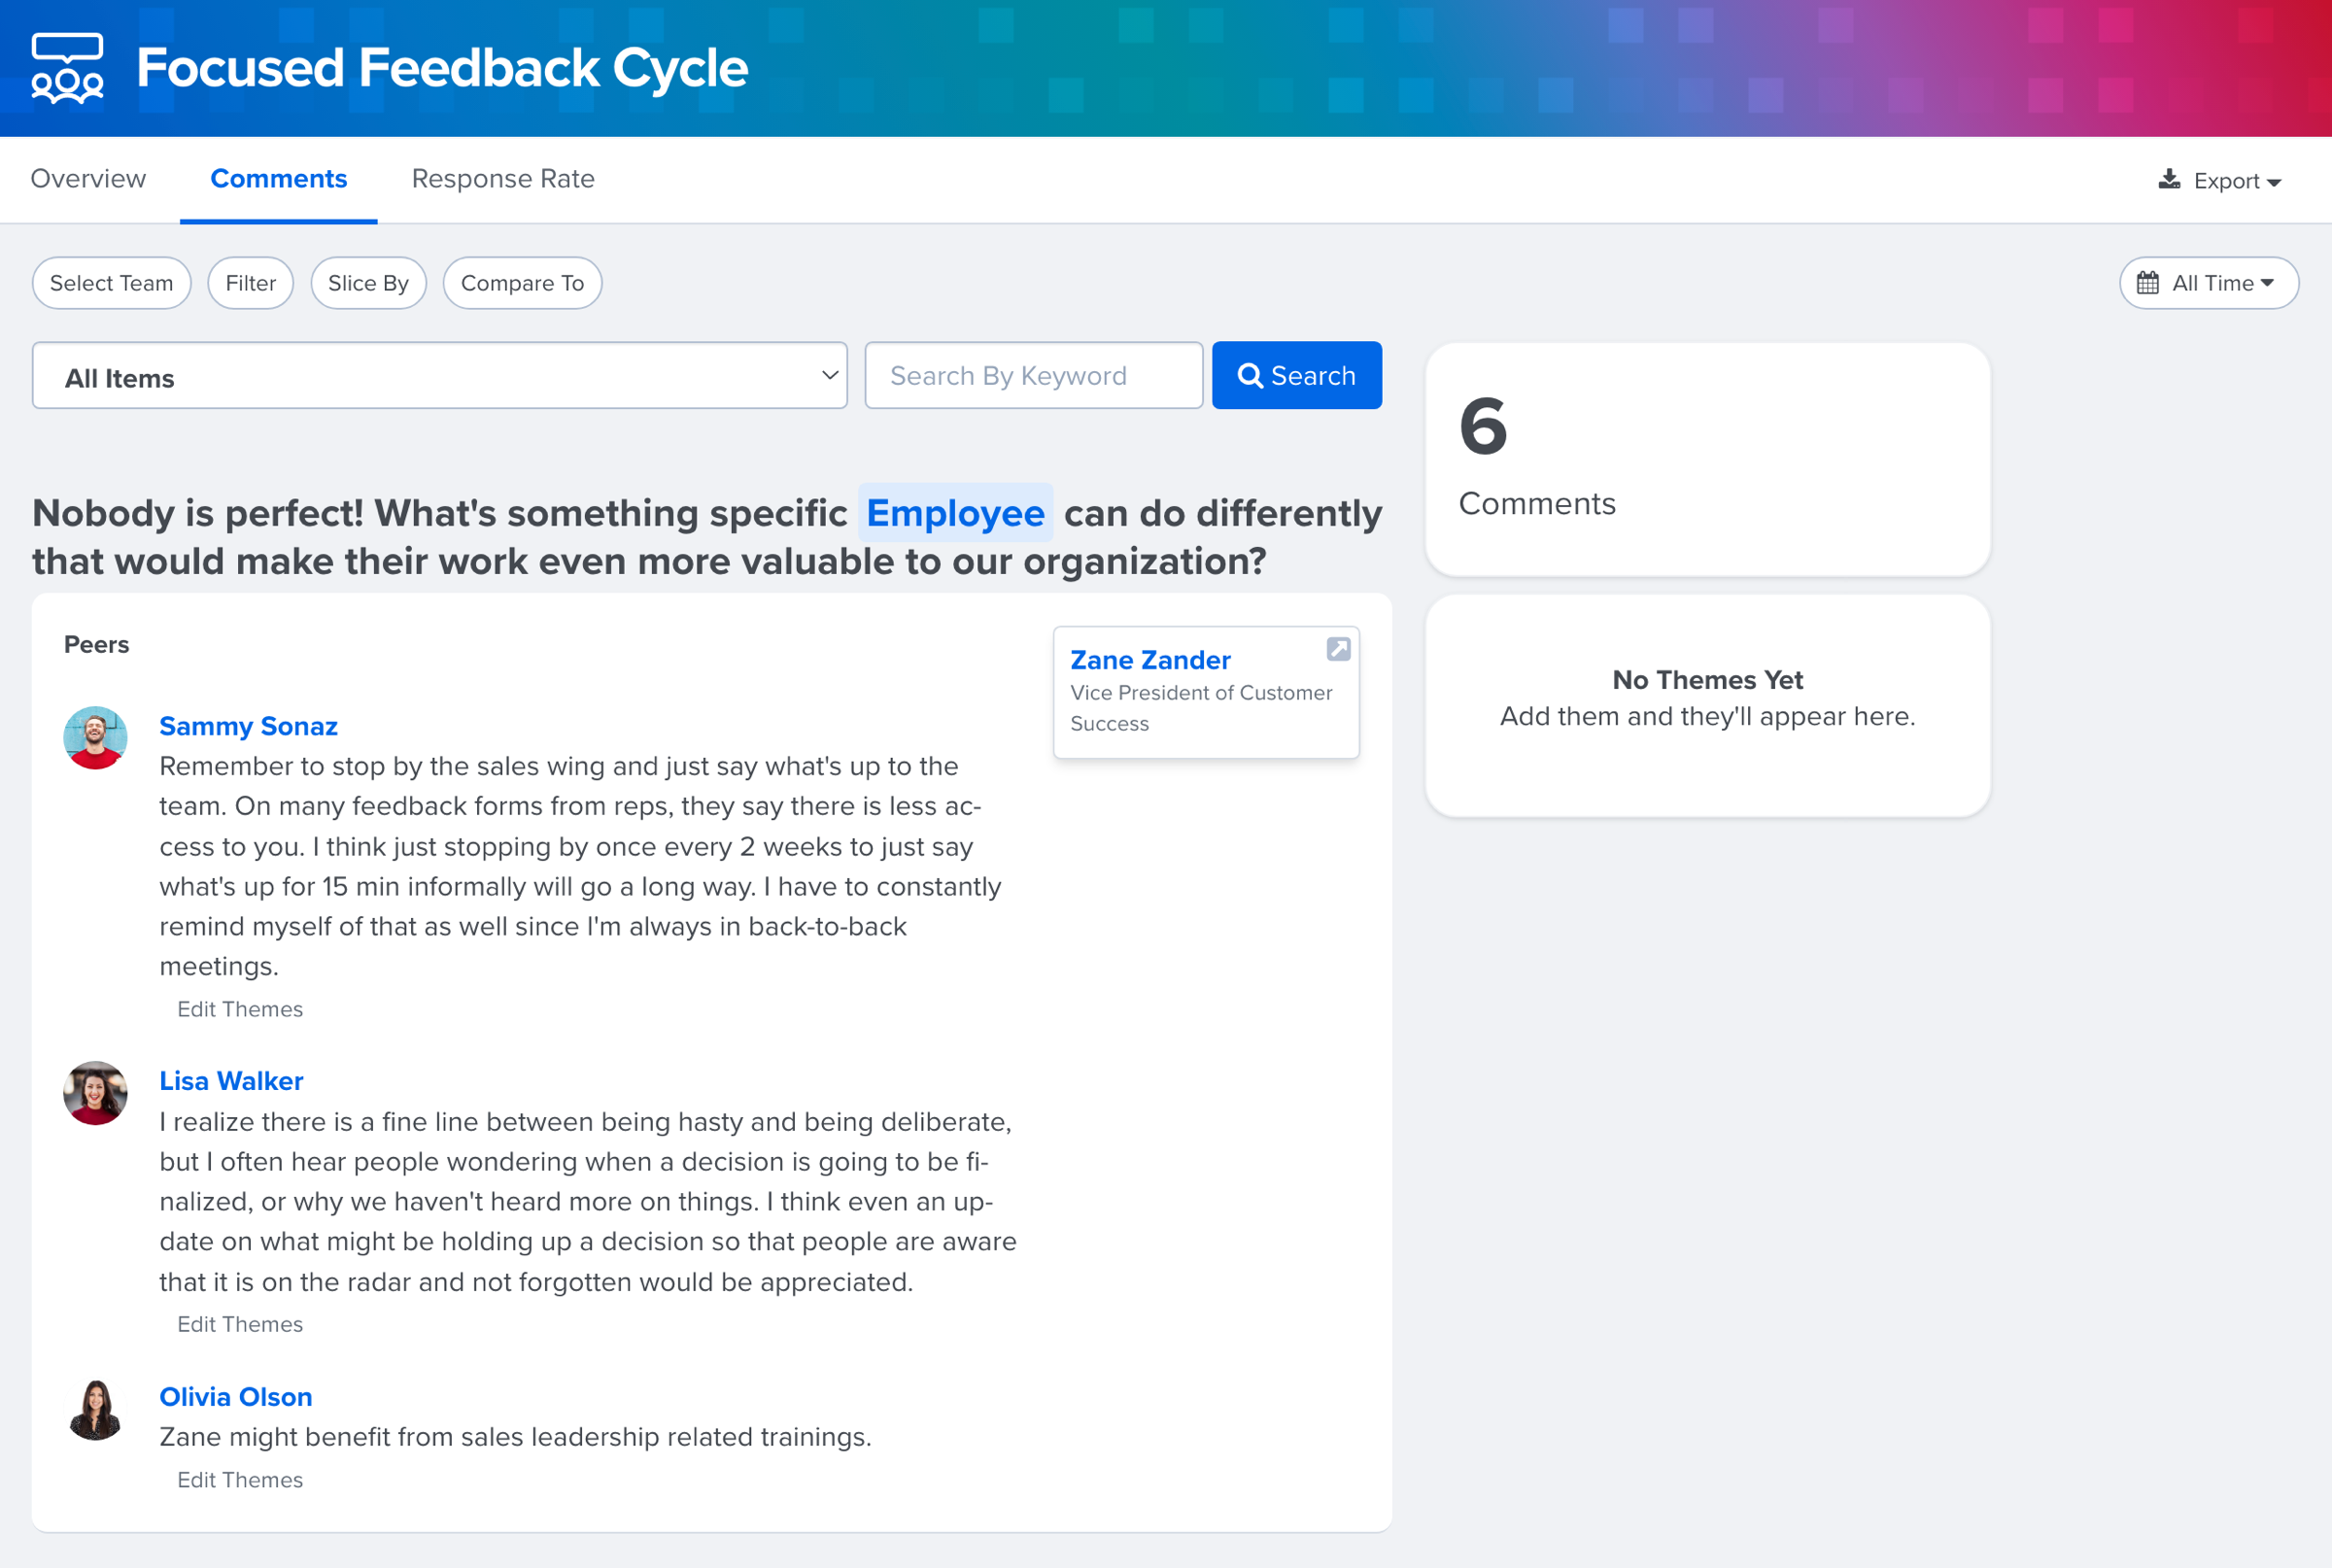
Comments Tab
Responses to open-ended questions in a feedback cycle are accessible on the Comments tab.
The comments are grouped by cycle questions with responses under each question. The recipient of the feedback cycle will be displayed in the top-right corner of the response card.
If the cycle was set up as confidential, the profile photo and name will be anonymous and will not contain personally identifiable information.
Confidentiality
For cycles that are confidential, the minimum response threshold is determined as part of the cycle set up before the cycle launches.
If you have set up the cycle to include Feedback Groups, the minimum response threshold must be met for any given Feedback Group to display results for that group.
For example, if the minimum response threshold is 3 and the cycle has been set up to include Direct Reports, you will need at least 3 direct reports to leave feedback for a given recipient in order to view their responses.
Open-Ended Results: Because open-ended responses are more difficult to protect by nature, open-ended responses are not displayed in the aggregate to protect confidentiality. Open-ended responses however will be displayed if they're already displayed at the individual report level.