This guide provides an overview of Survey Analytics and the different reports available when viewing survey results.
In this article:
- Overview
- Access Survey Analytics
- Analytics: Reporting Tools
- Report: Overview
- Report: Questions
- Report: Outcome Questions
- Report: Comments
- Report: Categories
- Report: Heat Map
- Report: Response Rate
- Report: Insights
Overview
When conducting a pulse or automated survey in Quantum Workplace, use survey analytics to examine your data and strategize follow-up action.
Use this article as a guide to help navigate the different reports and yield meaningful insights from your survey participants.
Survey analytics for Engagement surveys differ slightly from that of a pulse or automated survey. Learn more about Engagement survey analytics.
Access Survey Analytics
To access analytics for a survey:
- Click and expand the Analytics drop-down menu in the left-hand navigation menu
- Click Surveys & Pulses
- Click the survey to navigate to its analytics
Analytics: Reporting Tools
When viewing the different analytics reports available to you, use the different reporting tools available to you to view data from different angles and compare insightful data points.
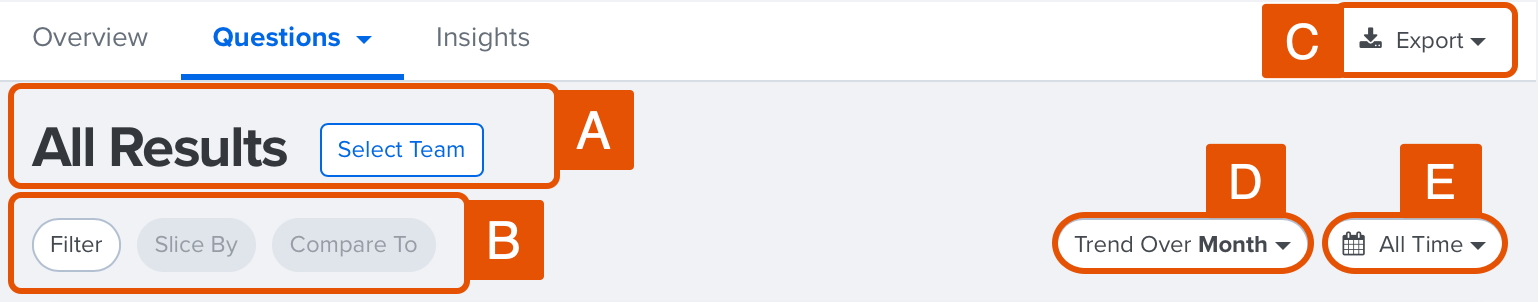
- A. Select Team: Useful for specifying the scope or team view of the analytics
- B. Filter, Slice, Compare To: Useful for viewing results by various demographics or comparing results against relevant benchmarks
- C. Export: Export the different reports for increased shareability
- D. Trend Over Time: Available to automated reports, useful for examining data over extended periods of time
- E. Time Range: Narrow the scale of your results to a specified time range
Active filters, slices, etc. automatically carry over as you navigate between the different survey reports and are applied to any exports.
Select Team
Depending on your organization's permissions, click Select Team to view analytics by branches of the Manager Org Tree or a custom org tree.
Learn more about custom org trees.
Filter By
Use the Filter function to isolate and view survey results by one demographic, e.g. by Department, Gender, Location, etc.
Slice By
Use the Slice By function to select a specific demographic and reveal a range of how the demographic responded to a survey question.
In the following example, the results are sliced by Department revealing how the Sales, Finance, and IT departments responded to the question.
.gif?quality=high&width=688&height=116&name=2023-02-08_17-27-26%20(1).gif)
Compare To
The Compare To function allows you to compare your results against a benchmark or previous survey.
Multiple Comparisons
The Compare To function allows you to add up to five comparisons and analyze how your survey results compare against previous surveys and different benchmarks.
Comparisons are represented via pins in the results.
If only a single comparison is active, the Comparison column is visible and indicates the difference in percentage points.
Trend Over Time
Available to automated surveys such as New Hire and Exit surveys. The Trend Over Time view helps make sense of data gathered over an extended period of time and examine how favorability changes over time.
Learn more about Trend Over Time.
Time Range
Use the Time Range function to view survey results according to the time the survey was submitted.
By default, the time range is set to All Time. Other pre-set time ranges include, This Month, Past 3 Months, Past 6 Months, Past Year, etc. A Custom Range option is also available.
Export Reports
From any report, you can export your data as PDFs, Powerpoints, or Excel spreadsheets via the Export button in the upper-right corner.
PDF and Excel exports reflect any slices, filters, and comparisons active at the time the report is exported. Excel exports include the actual data points you're examining.
Report: Overview
The Overview report displays key details for your survey, such as the reports available to you and information about the survey cycle.
How to navigate the Overview report:
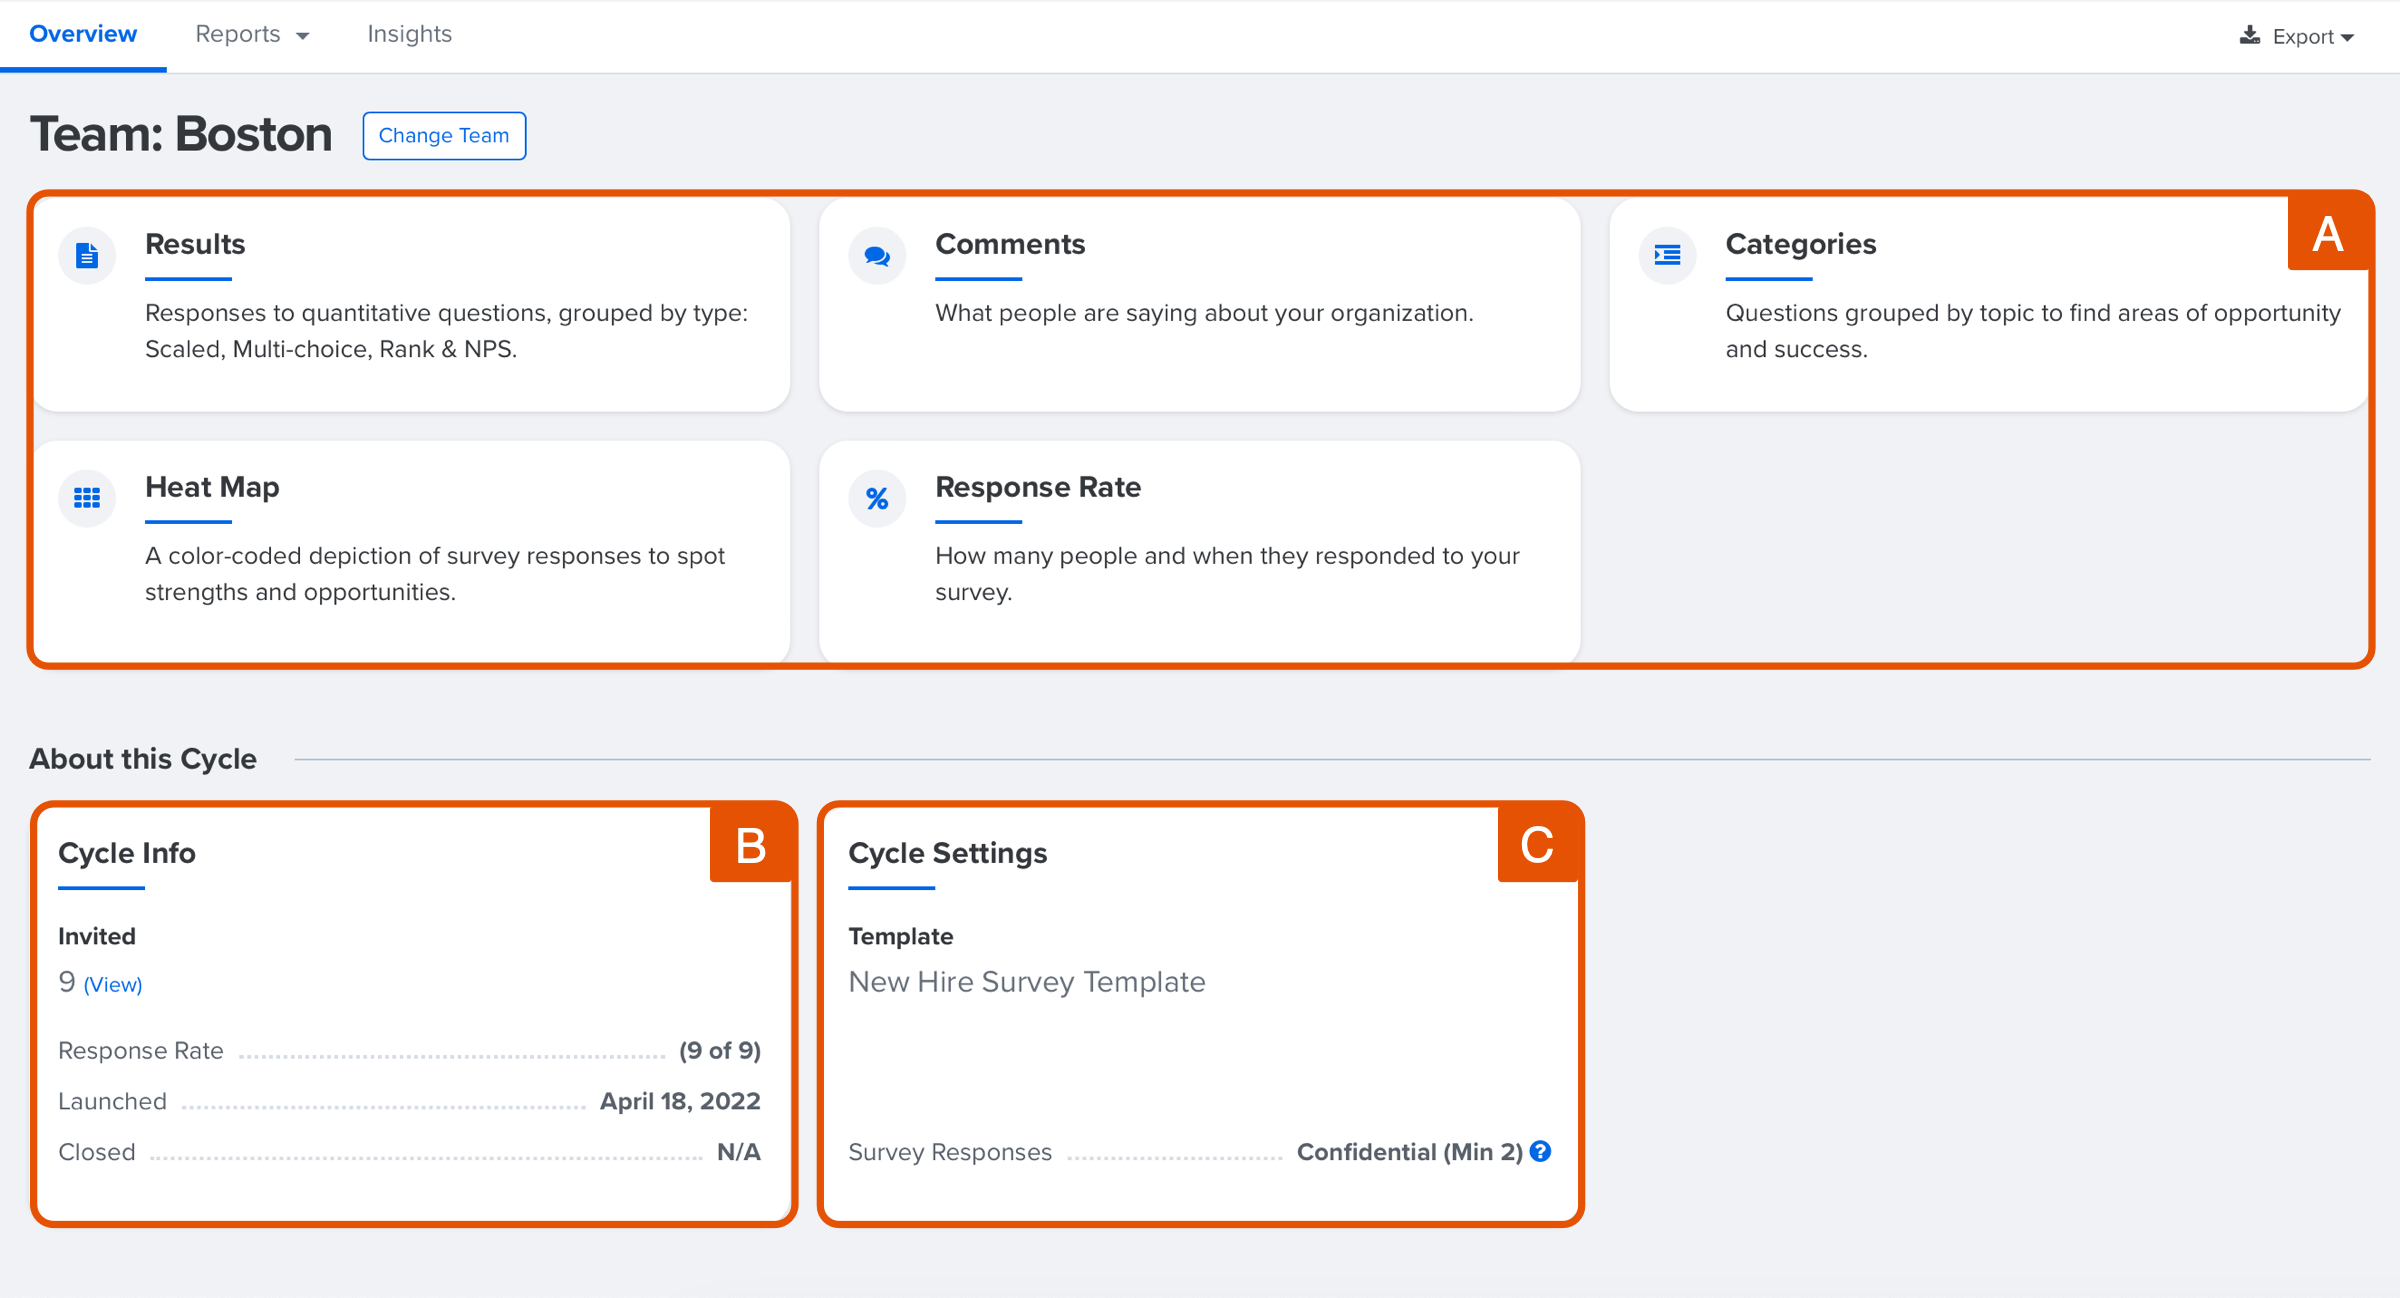
- A. Available Reports: Analytic reports available to you, click on any report to navigate to the associated tab in the analytics
- B. Cycle Info: Provides information about:
- Number of invited participants, click View for more details
- Response rate
- Launch date and if applicable, close date
- C. Cycle Settings: Provides information about the cycle's settings:
- Template used for the survey
- Confidentiality settings and Minimum number of questions required to view results
As an admin, you have visibility into the survey data for the entire organization.
As a manager, you have visibility into the results of your downline, but not for the rest of the organization.
Depending on your organization's permissions, you may be able to view aggregate data for your upline managers' downline or for the organization overall. Use the Select Team function to navigate data outside of your organization.
Overview: Admin View- Pre-Analytics
As an admin, you are presented with the following view for an open survey until the survey's analytics are available.
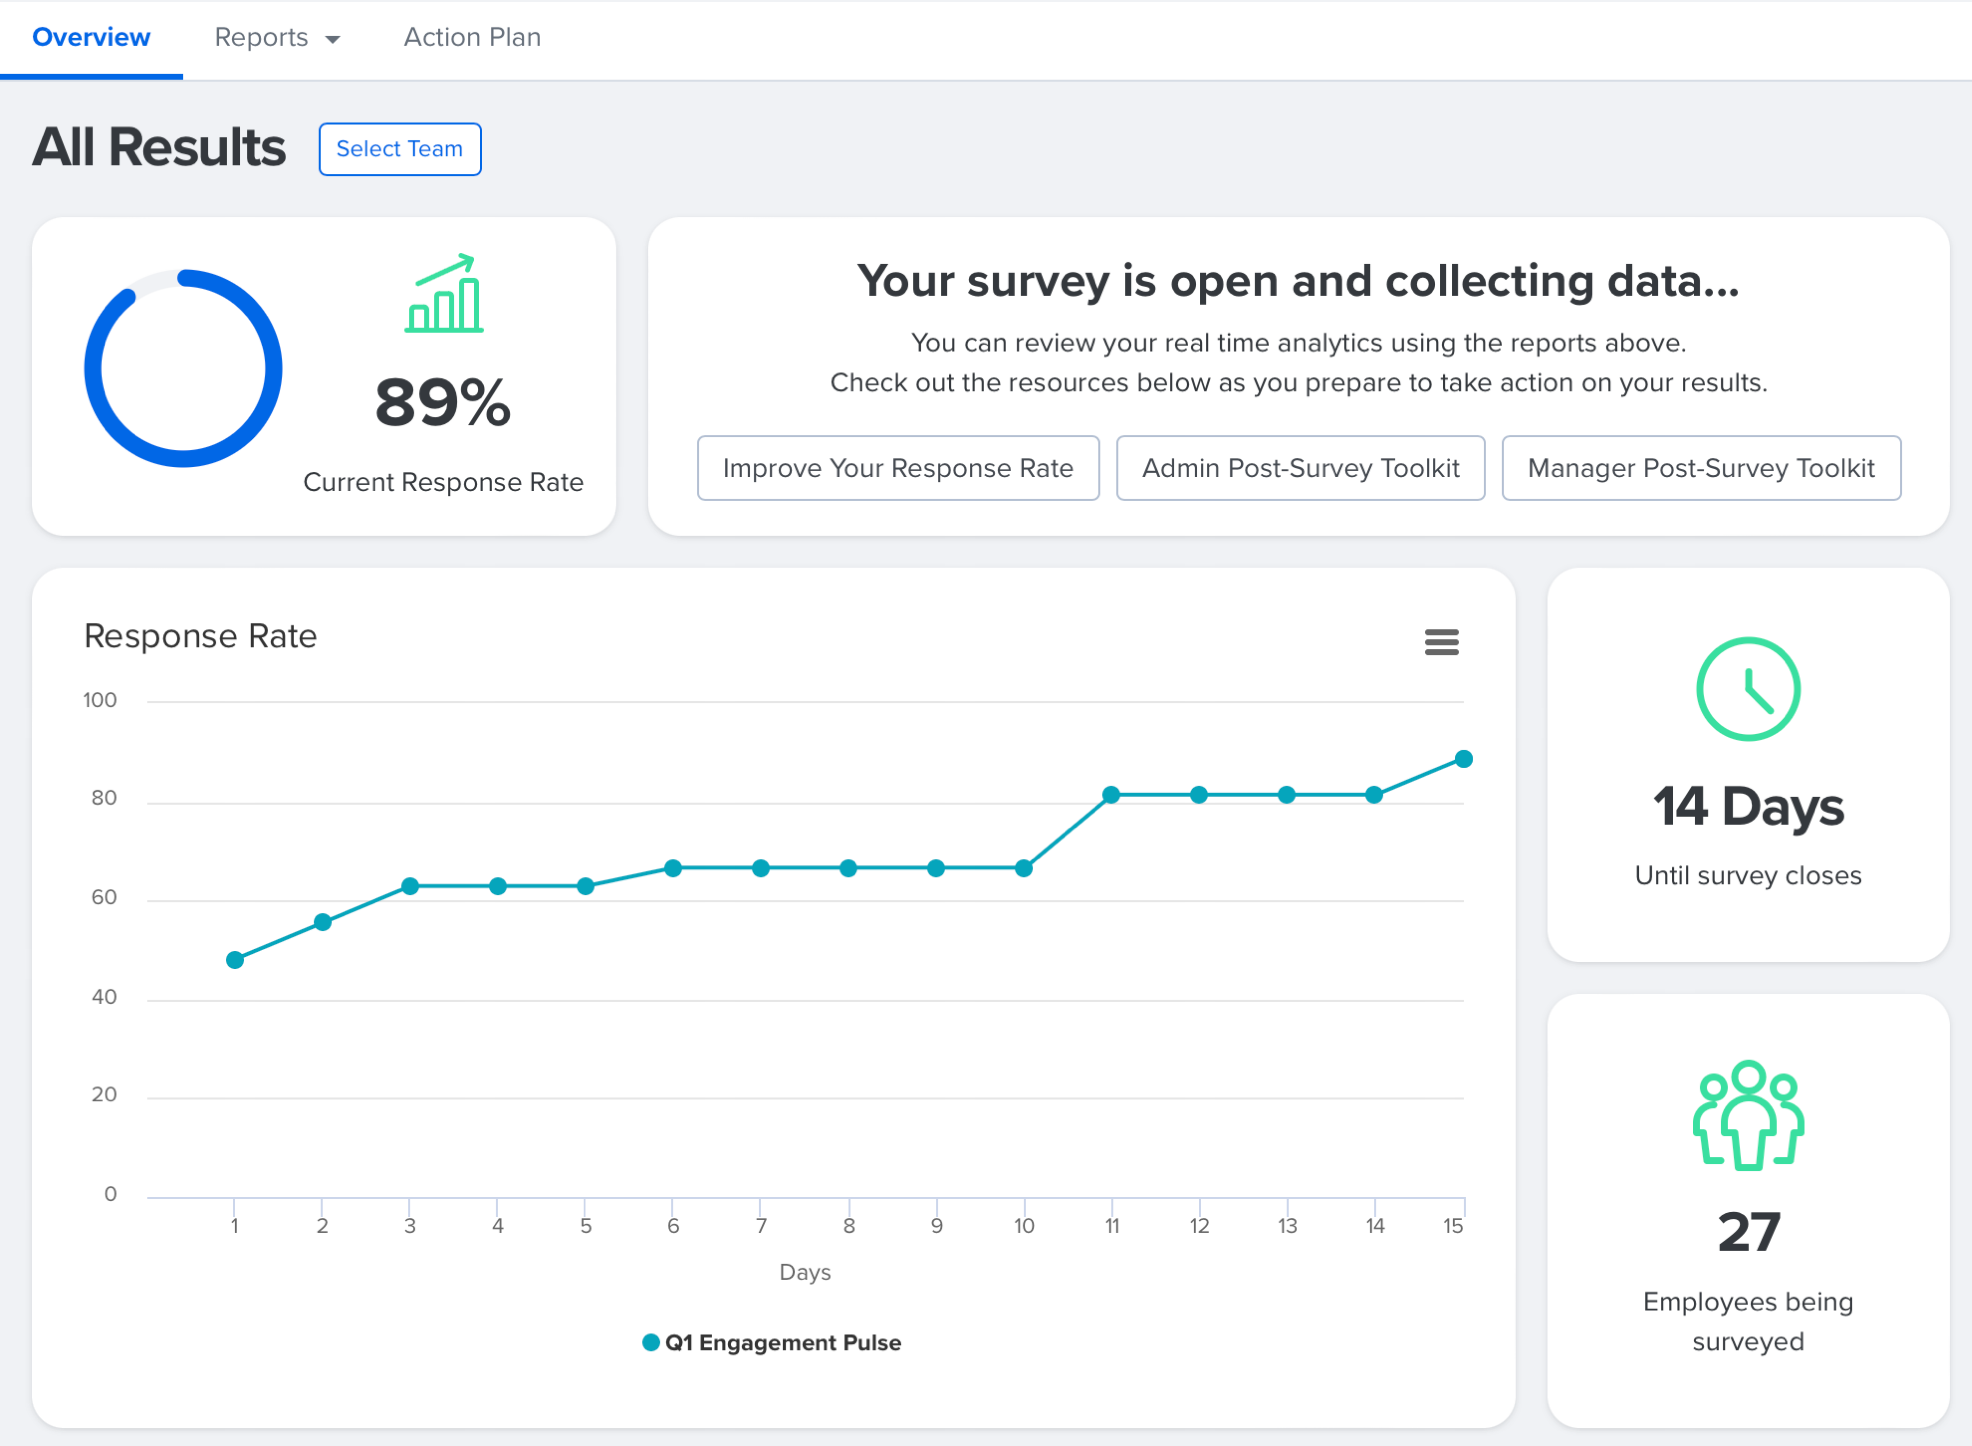
While survey participants complete the survey, take advantage of the help resources to improve your organization's response rate and prepare your admins and managers for action following the survey analytics.
This view details the survey's response rate in real-time as well as the rate over time as visualized with the line graph. If your organization has previous surveys in Quantum Workplace, click on the survey icon along the bottom to compare the response rate between surveys.
Also displayed are the number of employees being surveyed and the number of days before the survey closes.
Report: Questions
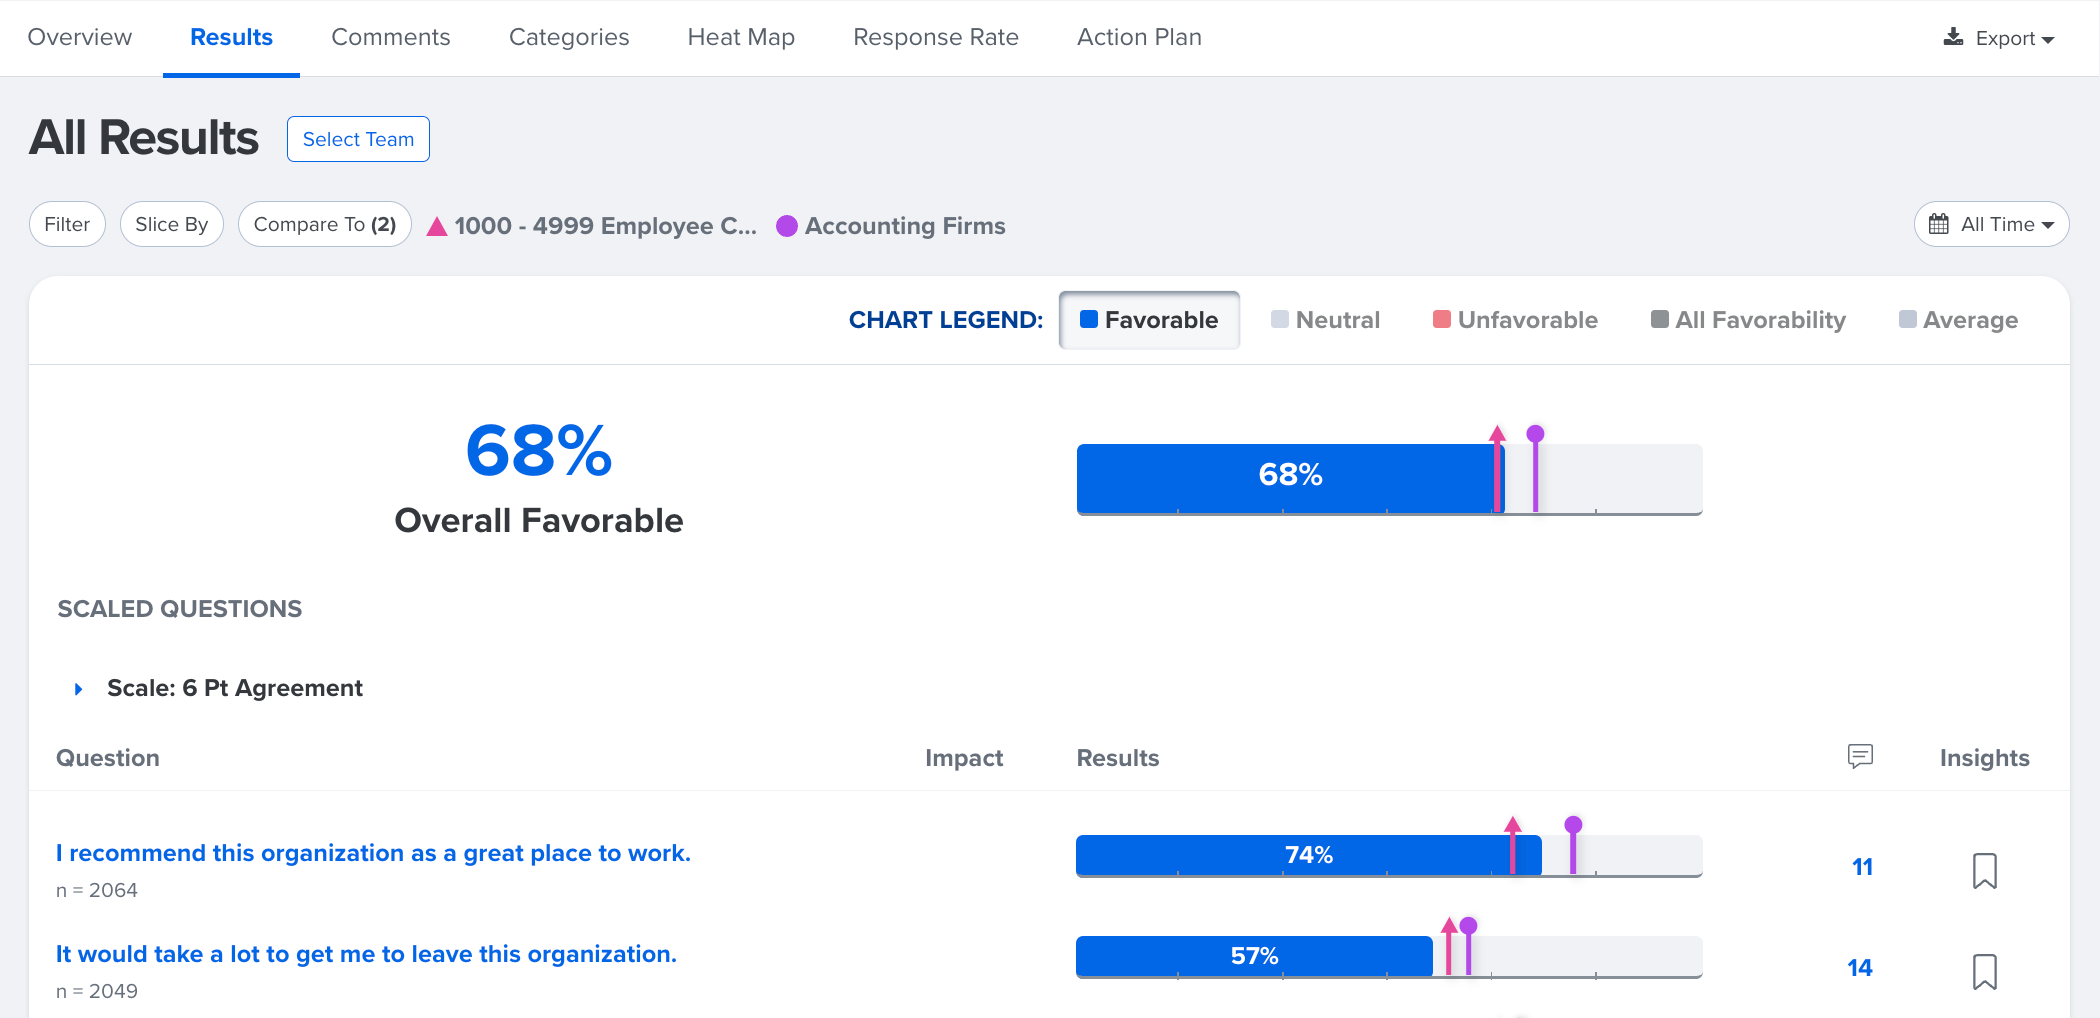
The Questions report displays the favorability score and lists the responses to all of the survey's scaled agreement items which are the majority of survey questions.
For automated surveys, as shown in the following image, trending data is available at the overall survey level and at the question level. Trending data are helpful when gathering large amounts of information over an extended amount of time, such as with New Hire or Exit surveys. Learn more about Trend Over Time.
Pulse and Engagement surveys instead display the favorability score for the survey level as well as at the question level.
Other question types, i.e. multiple-choice, single-choice, or NPS questions are also listed in the Questions report.
How to navigate the Questions report:
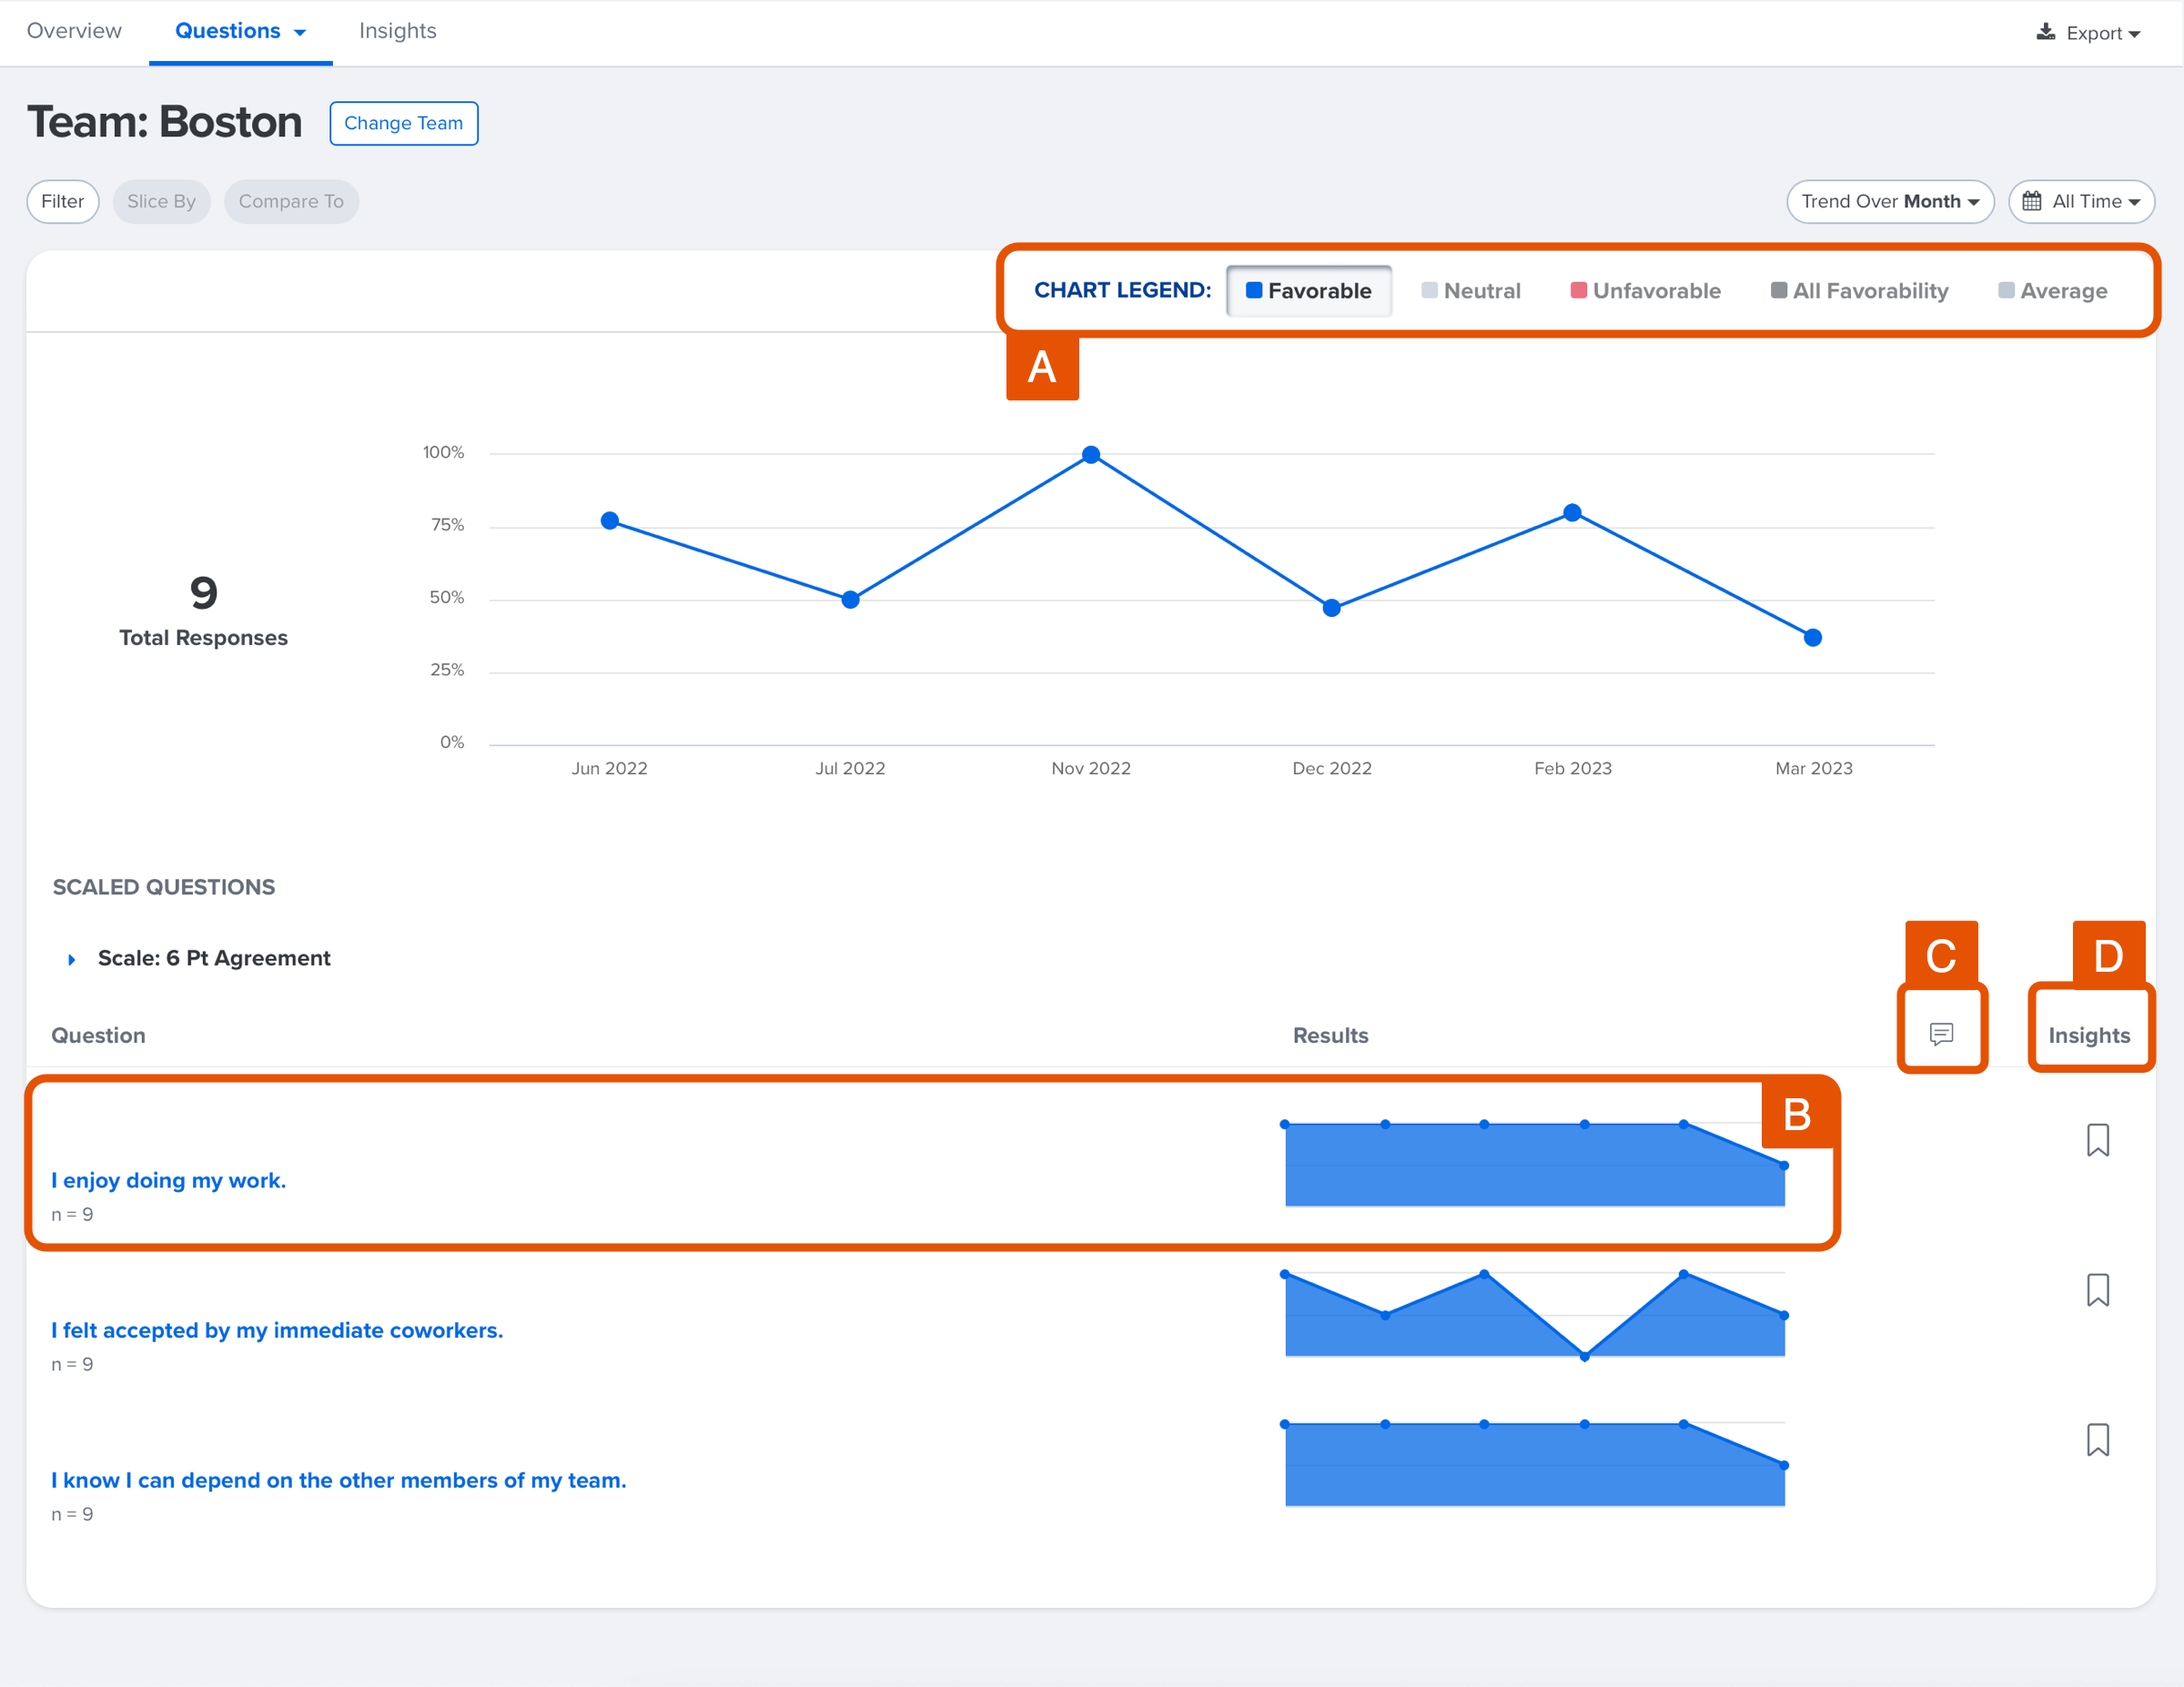
- A. Chart Legend: By default displays, the Favorable score but can be used to view results via different responses, all responses, or by the average
- Favorable: Agree & Strongly Agree responses
- Neutral: Somewhat Agree & Somewhat Disagree responses
- Unfavorable: Disagree & Strongly Disagree responses
- All Favorability: Displays all three of the above responses
- Average: View the average score out of the possible six points
- B. Question & N-Count: The question as it appears on the survey, the number of responses received, and the question's favorability score
- For automated surveys, the interactable graph shows the favorability for the month or quarter, depending on the Trend Over Time settings
- Click on the question to open the Question-Level view for more details
- Comments: Displays the number of comments received by survey participants, click to navigate to the Comments report
- Insights: Click to create an insight for the question and add it to an action plan, learn more about Insights
Question-Level View
Question-Level View is an extension of the Questions report data that allows you to continue your analysis into specific questions.
Examining your survey items in this view can help connect survey information across the other reports into a cohesive employee story.
To view a question in greater detail:
- Click on the survey question
- Use the filter, slice, comparison, and Trend Over Time functions to yield different insights from the question
- Click the Insights ribbon to save and organize your findings
Report: Outcome Questions
The Outcome Questions reports provide a similar experience to the Questions report but only include Outcome questions in the survey for easier analysis.
This report is available if:
- The survey includes a minimum of one Outcome question
The Engagement Outcomes report is the alternative for engagement surveys, learn more.
Report: Comments
All text-based responses submitted by survey participants are captured in the Comments report. This includes responses to all open-ended questions and comments left by participants in response to scaled agreement items.
How to navigate the Comments report:
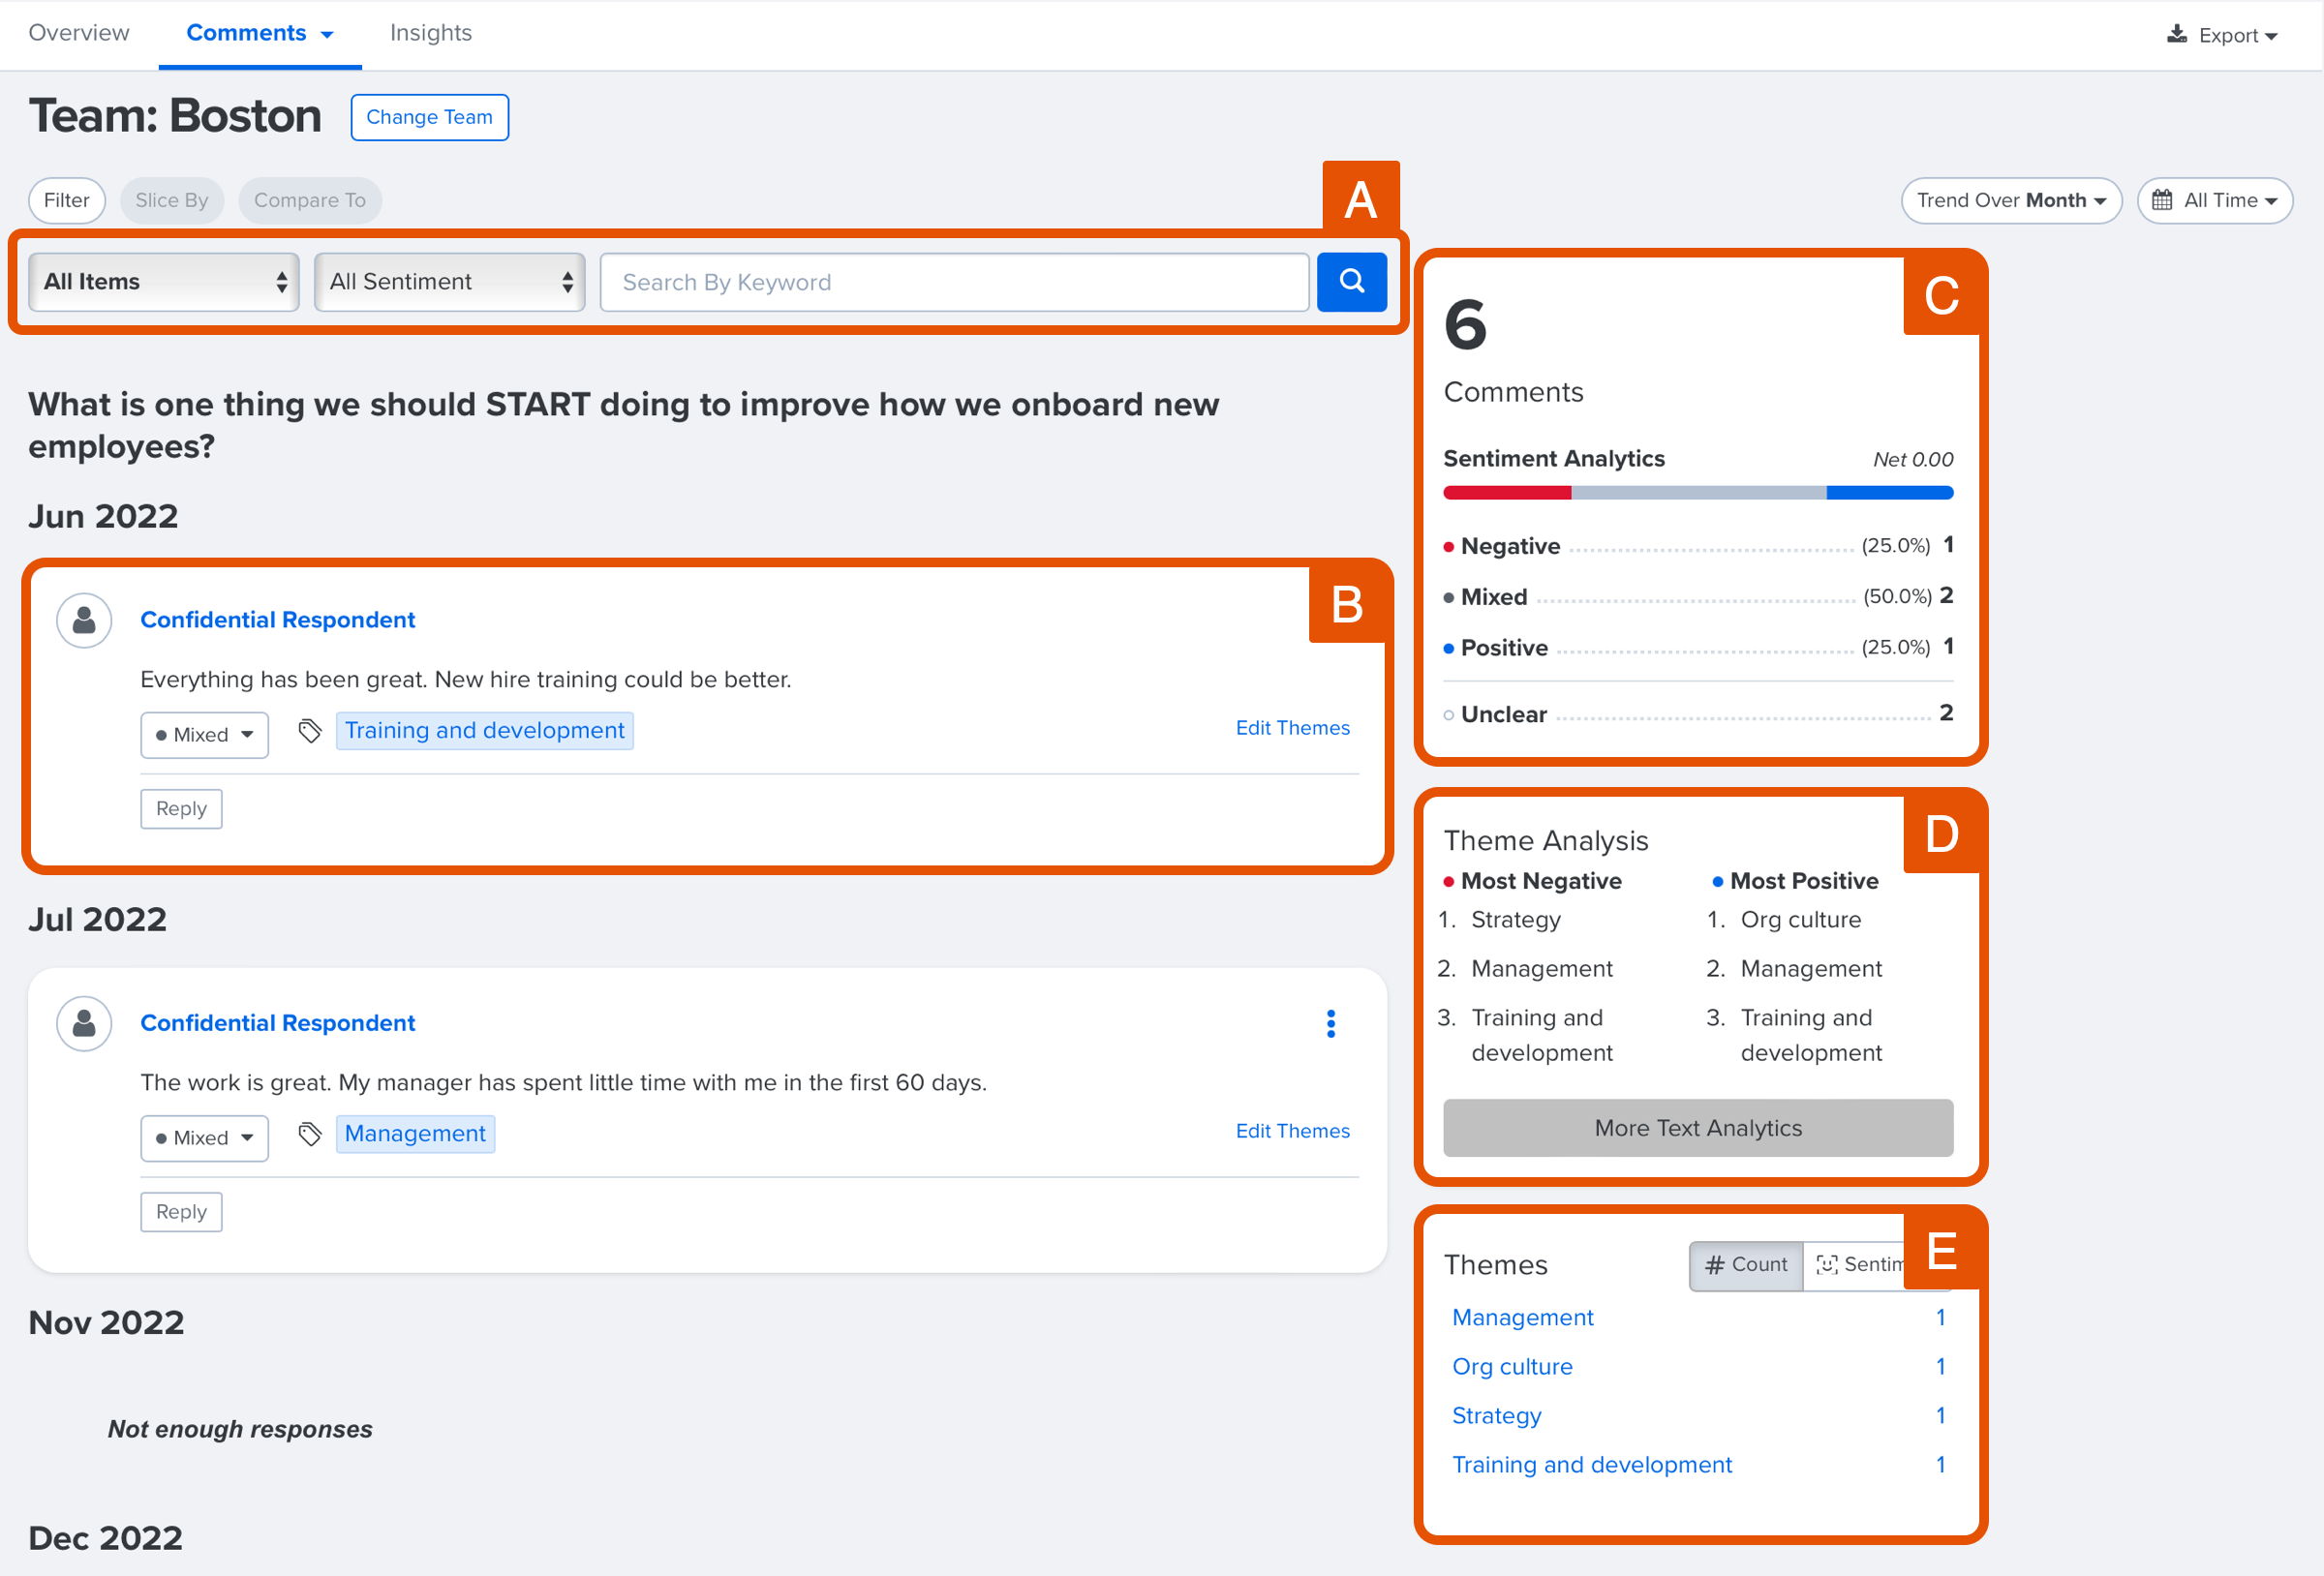
- A. Item Filter/Search: Use the drop-down menus or keyword search to filter the displayed comments
- Use the first drop-down to display comments by category, or question, or show all
- Use the Sentiment drop-down to filter the comments view by Negative, Mixed, Positive, or Unclear sentiment
- Use the text field to search and show comments by the specified keyword
- B. Comment: Relevant comments to the selected question or category (Figure A) that contain the participant's comment, automatically assigned sentiment and theme
- Click the ⋮ icon to quarantine a potentially damaging comment, learn more about quarantining comments
- To edit/add a sentiment or theme, click the drop-down or Edit Themes respectively and select the appropriate option
- Click Reply to leave a comment and communicate with the participant who left the comment, learn more about comment replies
- C. Sentiment Analytics: Provides a visual of the breakdown of the number of displayed comments and their sentiment, learn more about sentiments and themes in the Comments report
- D. Theme Analytics: Lists the three most negative and most positive themes
- Click More Text Analytics to view theme and sentiment data visually, learn more about text analytics
- E. Theme Count/Sentiment: Toggle between displaying themes and the associated amount or the color-coded sentiment
Comment Translations
Survey comments come in all languages. The Comments report offers the users, side-by-side translations.
Translated comments contain a Show Original Language button, which allows readers to see the comment as written and understand the original language and translation source.
The keyword search returns matches from both the original and translated comment.
Translations, including the original and translated language, are included in the Excel report. Although the original comment is not included in the PDF export, the translation source, if needed, can be accessed in the report.
Quantum Workplace can source translations from an online translation service for free or from a team of professional linguists for an additional fee.
Contact your CIM/CSM for any comment translation-related questions.
Report: Categories
The Categories report provides the favorability information similar to the Questions report, but at the category level.
How to navigate the Categories report:
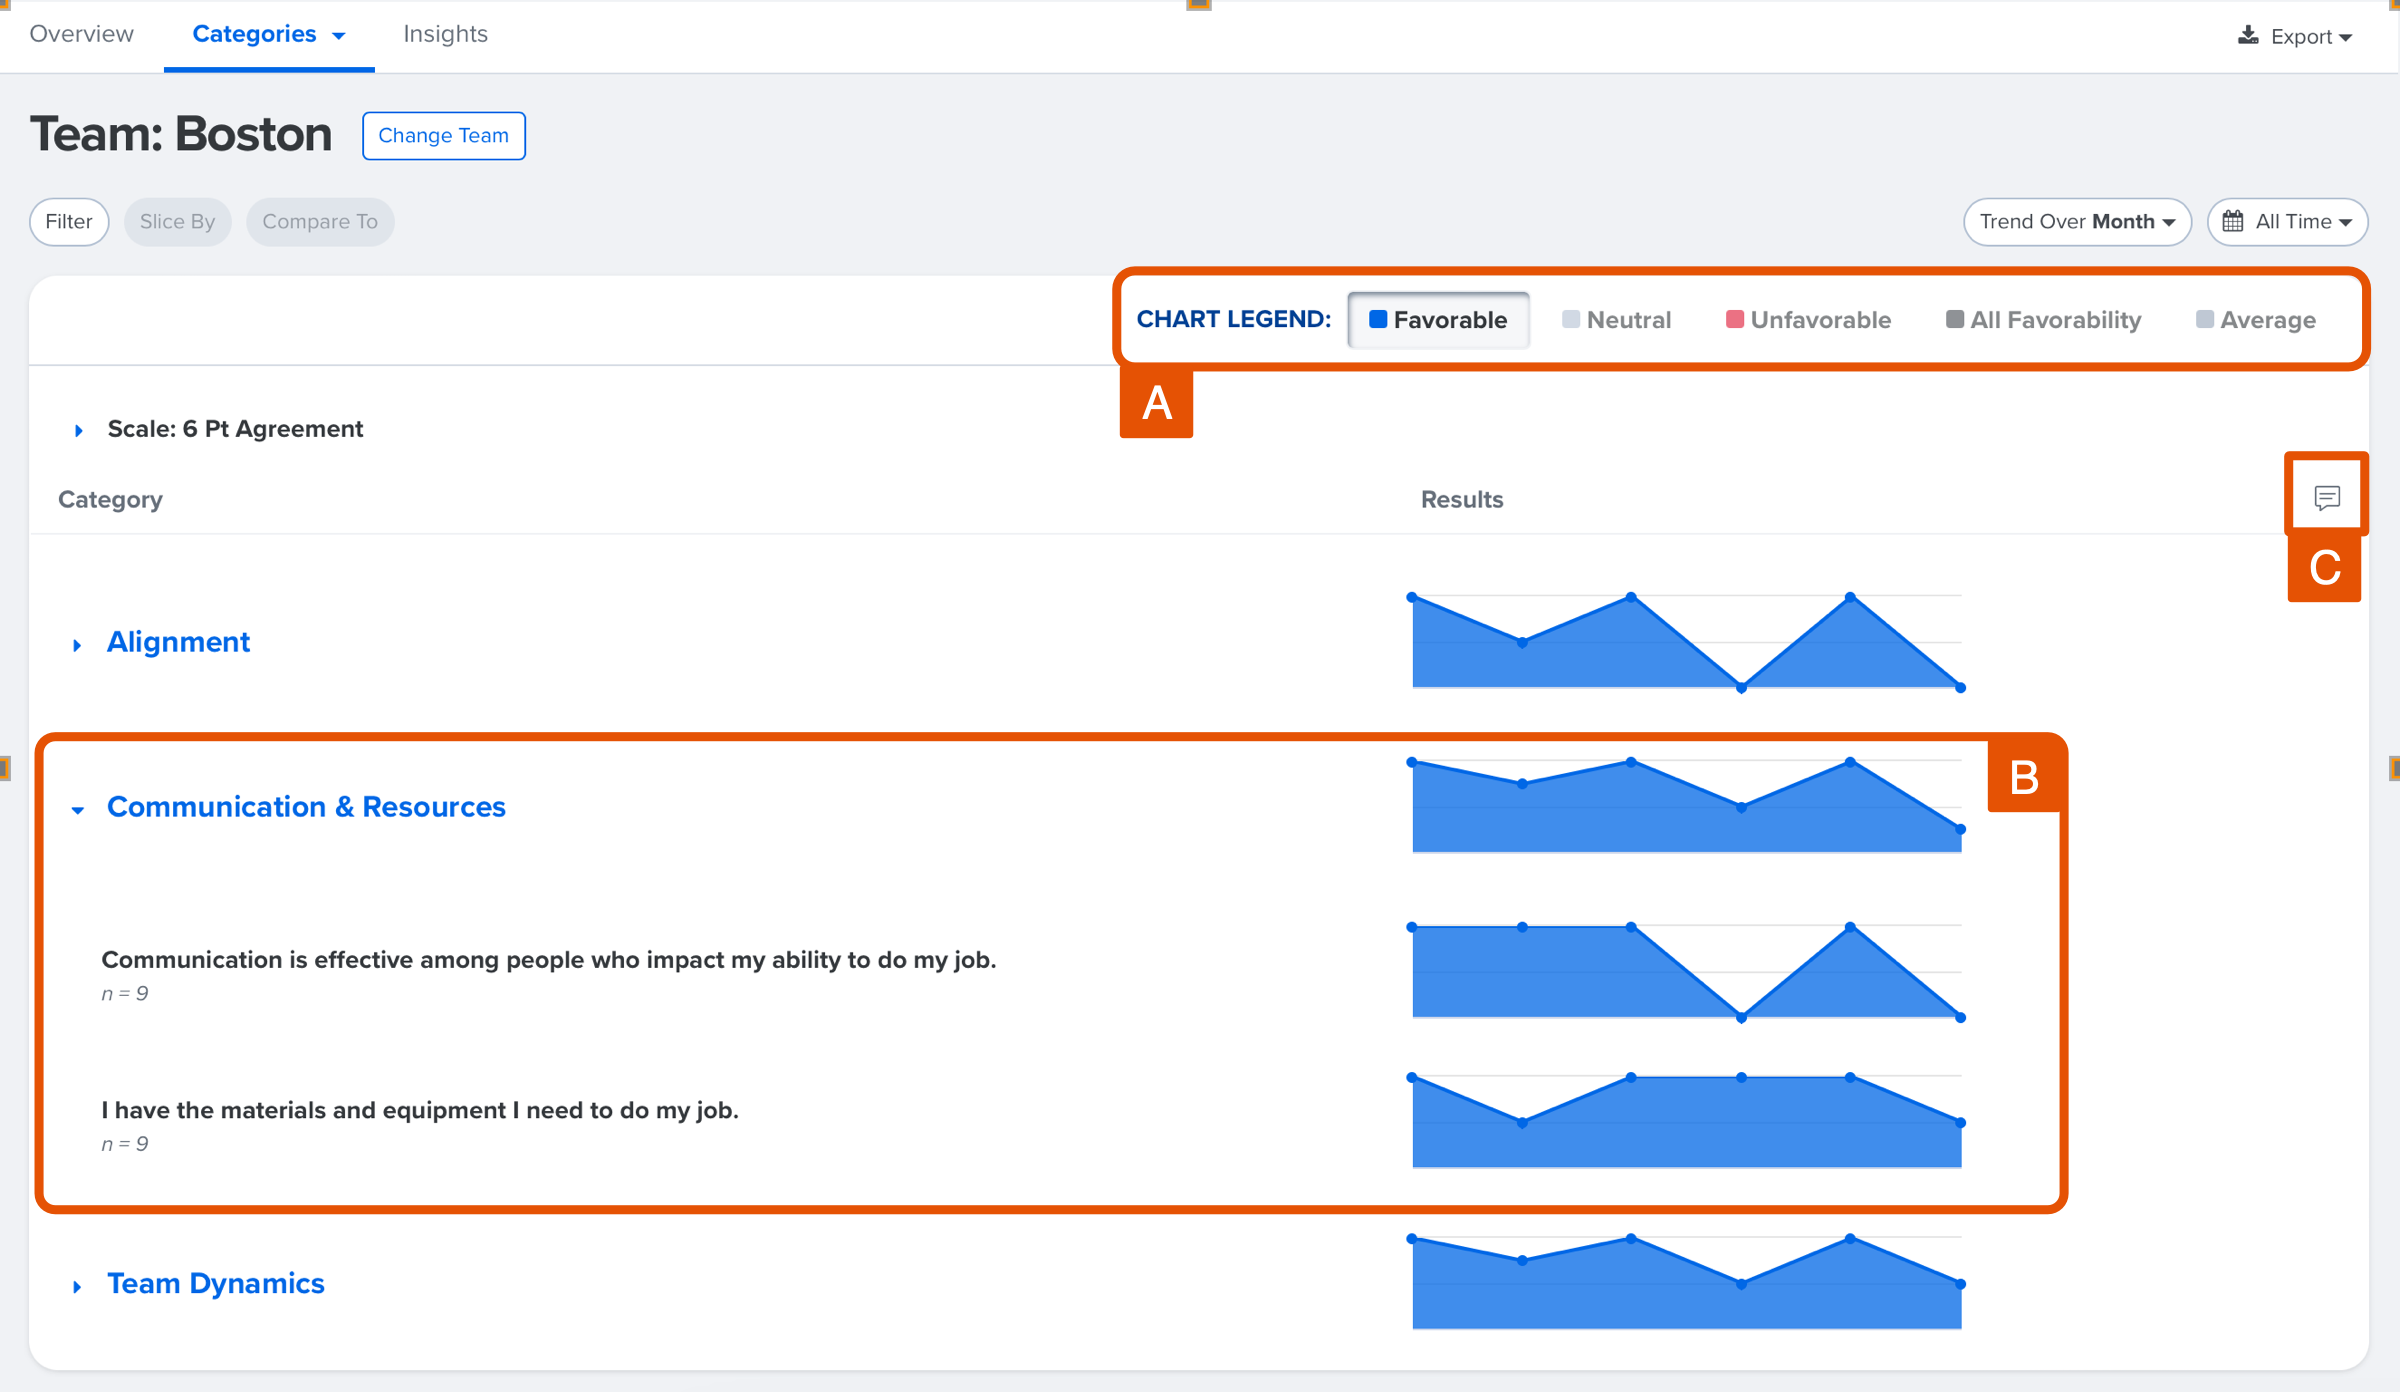
- A. Chart Legend: By default displays, the Favorable score but can be used to view results via different responses, all responses, or by the average
- Favorable: Agree & Strongly Agree responses
- Neutral: Somewhat Agree & Somewhat Disagree responses
- Unfavorable: Disagree & Strongly Disagree responses
- All Favorability: Displays all three of the above responses
- Average: View the average score out of the possible six points
- B. Categories: Each question category and its favorability score
- Expand a category to see the questions under the category and the associated scores
- C. Comments: Displays the number of comments received by survey participants, click to navigate to the Comments report
Trending data on the Categories report is calculated by the category itself, regardless of what questions are included in a category.
For example, let's look at data across multiple surveys for a category titled, Communication. In one survey, this category includes questions A, B, and C, and in a different survey, the same category includes questions D, E, and F.
Trending data for the category, Communication, will reflect questions A - F because they were included under the same category of Communication.
Report: Heat Map
The Heat Map report provides a visual representation of how different groups within a demographic, i.e. Departments, Locations, etc., responded to scaled agreement items and categories on the survey.
When viewing the Heat Map, the leftmost column represents the average favorability score across all demographics currently being sliced by. Depending on your role, this column indicates varying information:
- Full admins: this column averages favorability for the organization overall
- Focused admins: this column indicates average favorability within their scope
- Managers: this column indicates average favorability within their downline
The Heat Map uses a white-blue color scale, with white indicating low favorability and blue indicating high favorability. As favorability increases, the cell will gradually take on a deeper blue gradient.
The first row of the Heat Map displays the Response Count or the number of responses being represented.
Note: Response Count information is not included when exporting to Excel.
How to use the Heat Map:
.gif?quality=high&width=688&height=341&name=2023-04-18_16-41-08%20(1).gif)
- Enable Trend Over Time or a demographic slice via Slice By
- If Trend Over Time is enabled, click Filter to isolate the selected demographic
- If slicing by a demographic, click Slice By and select a demographic
Optionally for Full Admins and Focused Admins, in the Slice By modal, click Add Intersection to add an additional demographic and view intersectional data. This will reflect the results for the two selected demographics.
To view the individual results for questions within a category, click the drop-down arrow.
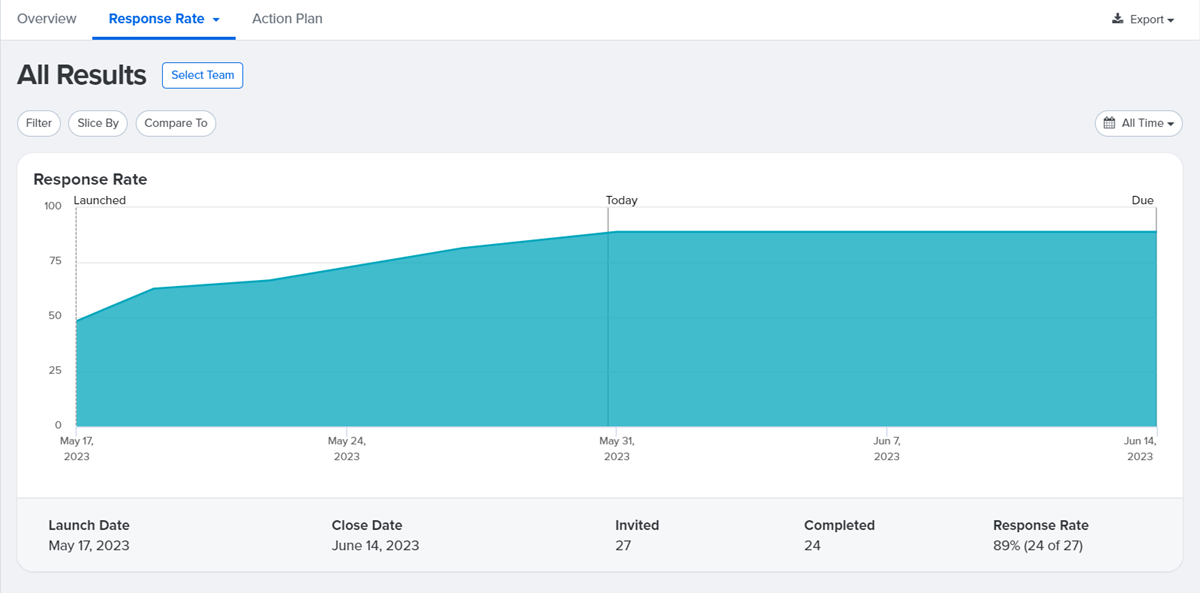
Report: Response Rate
The Response Rate report displays the percentage of survey participants who completed the survey and shows how the completion rate changed over the survey period.
This report also includes a list of invited survey participants. Attributed surveys will indicate the identity of the participant and their completion status. Confidential surveys do not indicate whether an invited participant has completed the survey or not.
This report is available as soon as the survey launches to track the response rate in real-time.
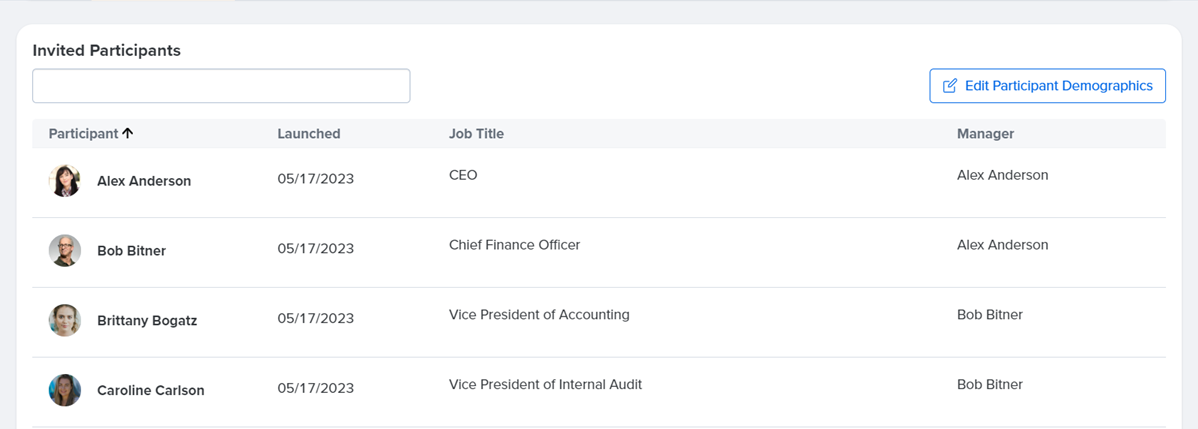
For reporting purposes, click Edit Participant Demographics to update a user's demographics. Any changes to a user's demographics only affect the selected survey.
Report: Insights
Insights about the survey data you've made are collected in the Insights report.
As you navigate through the different reports, click the Insights ribbon icon to bookmark any thoughts you might have about particular survey questions.
How to use the Insights report:
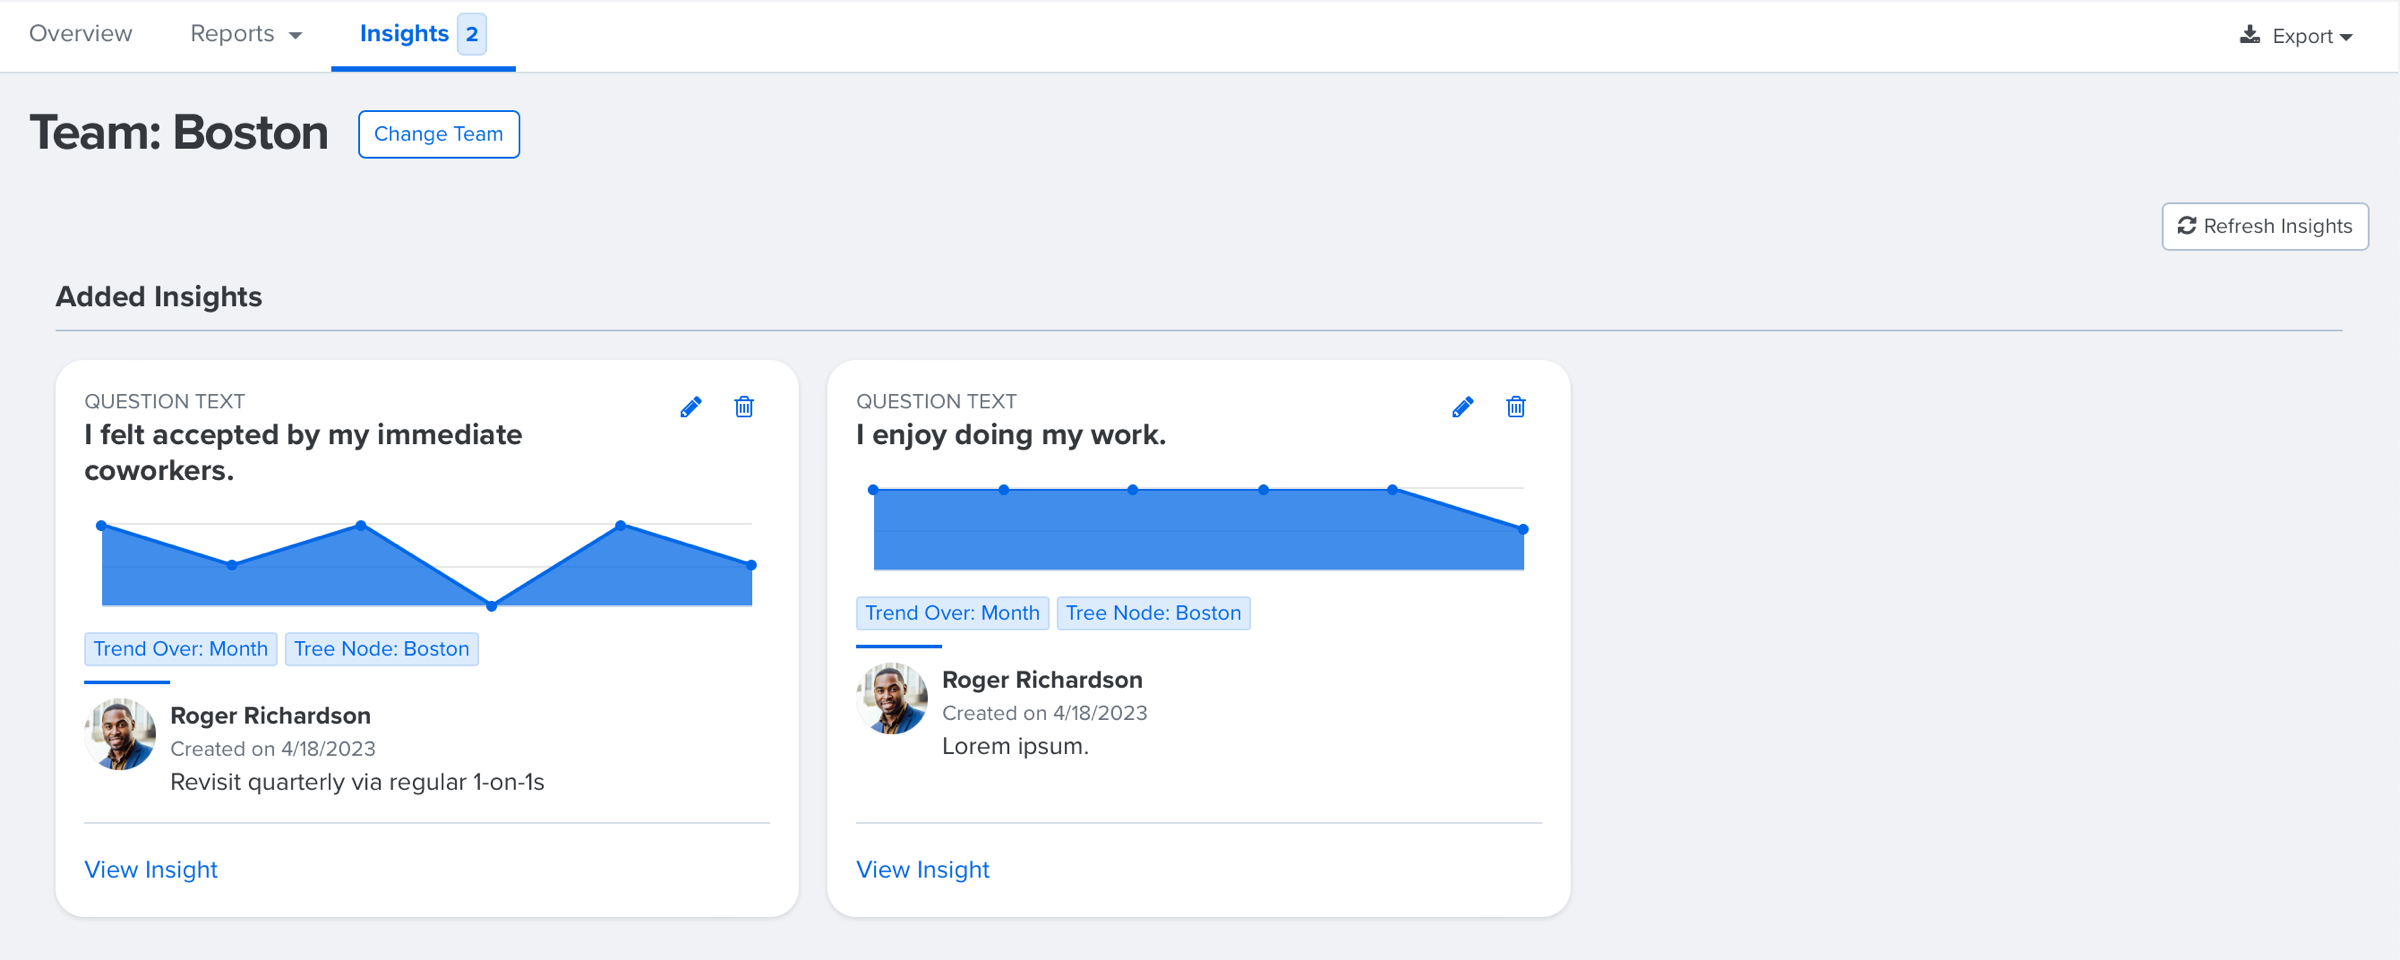
- Click View Insights to view the question in its original report
- Click the Edit icon to adjust your insight
- Click the Delete icon to delete the insight from the report