In this article:
- Overview
- Adding Rank Items to a Template
- Feedback Provider Experience
- Pulse Analytics
- Individual Feedback Report
- Feedback Analytics
Overview
Rank Items allow you to understand relative perceptions among a set of response options. Rank Items are available within Surveys and Feedback.
For example, imagine that you want to ask employees to weigh in on what they see as the most important organization initiatives. You can use a rank item to tease out which initatives are viewed as most important by a majority of employees.
Adding Rank Items to a Template
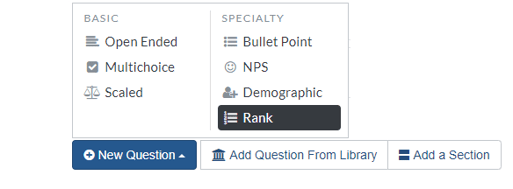
When you’re building your template (whether it's a survey or Feedback template), you’ll add Rank items by selecting Rank from the New Question menu:
Enter the text of the question as you normally would. Under Choices, add the options you would like your employees to rank. 
You also have the additional options to customize your question:
- Set Minimum Choices: require Feedback Providers to rank at least N choices.
- Set Maximum Choices: require Feedback Providers to rank no more than N choices.
- Randomize Item Order: ensure users see the choices in a random order to guard against bias.
Employee Experience with Rank Items
Regardless of whether you are including Rank items in a Feedback session or a Pulse Survey, the experience is the same for your employees. Your employees will simply click their choices in the order they want to rank them. As they click, they'll see the rank appear next to their choice. If you've set a minimum number of options to rank, they'll know they've hit the minimum once their answers turn green. If they need to start fresh, they simply click "Clear your selections".

Survey Analytics
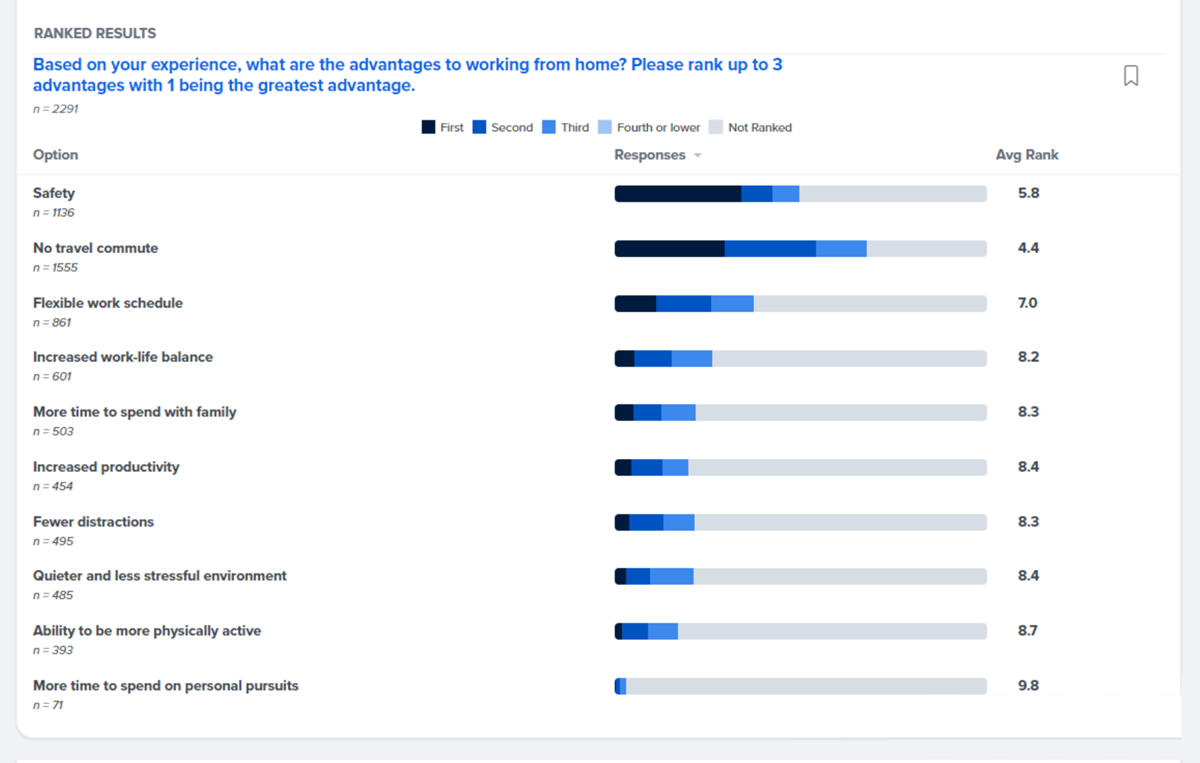
For ranked questions, the results highlight the number of respondents selecting each choice and the weighted average for each survey item.
The results for each option also show a color-coded breakout of how often a particular option was selected as a respondent's first, second, third, etc. choice.
When viewing a question's ranked results, click the Responses column and Avg. Rank column to toggle how the results are sorted.
Calculating Average Rank for Rank Questions
Each survey item is weighed by how they rank, i.e. first, second, third, etc. Not Ranked is still considered a rank and is weighed as the lowest rank possible.
The formula for Average Rank:
((R1*1) + (R2*2) + (R3*3) etc. + (NR*Max +1)) / Total number of respondents
-
- R1 = Rank 1, first choice
- NR = Not Ranked
- Max + 1 = last numbered rank + 1, assigned to Not Ranked
- Example: For a survey ranking a top three, NR*Max +1 would look like (NR*4)
Individual Feedback Report
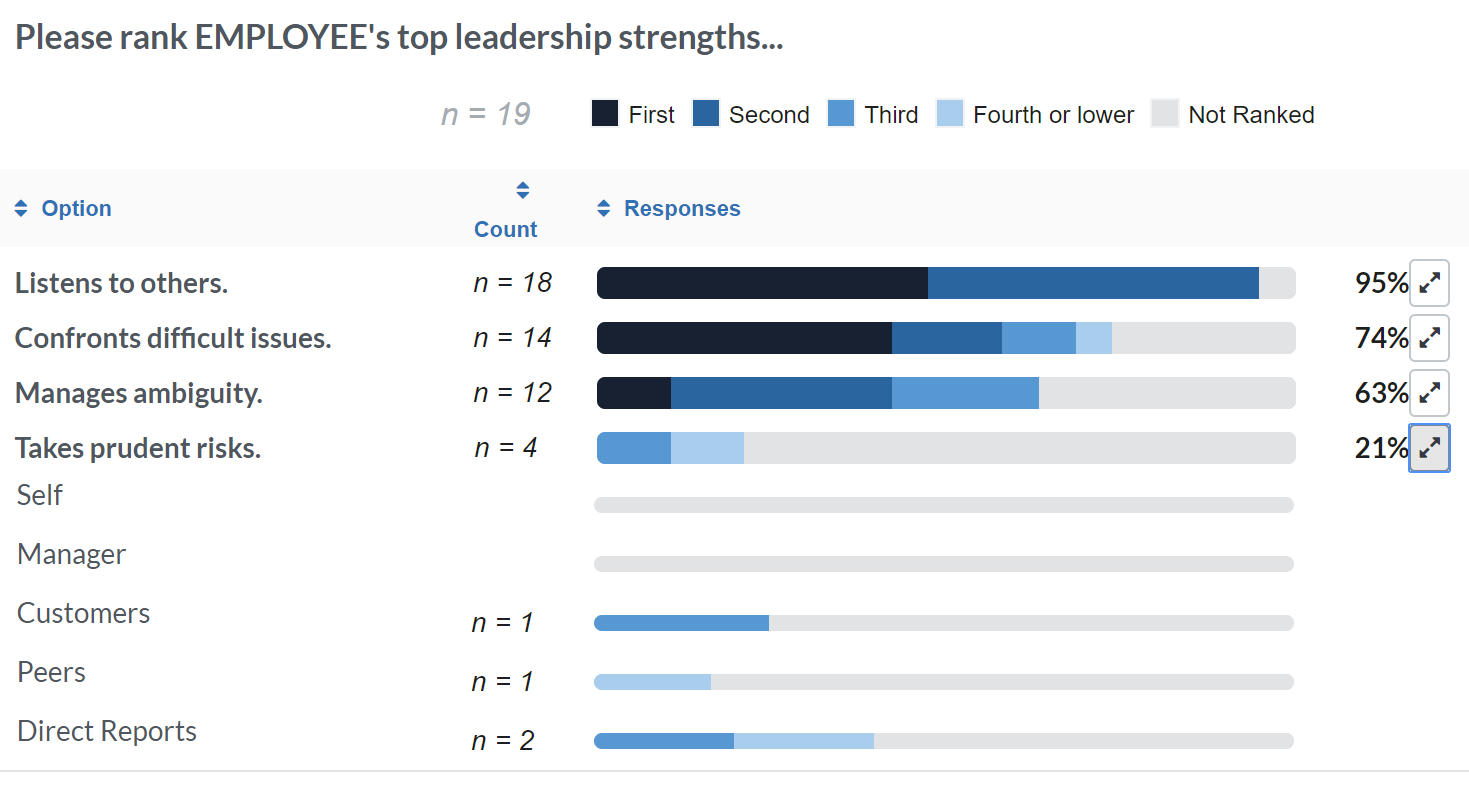
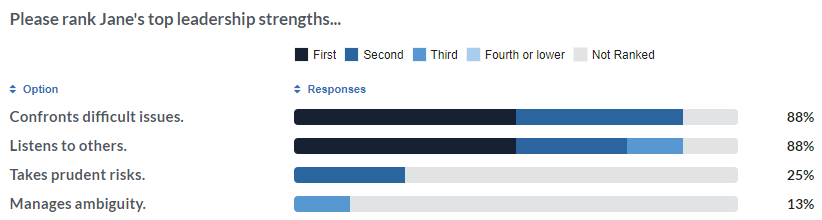
Ungrouped Feedback: The Individual Feedback report makes it easy to see that Jane’s top perceived strengths are confronting difficult issues and listening to others (not taking risks nor managing ambiguity).
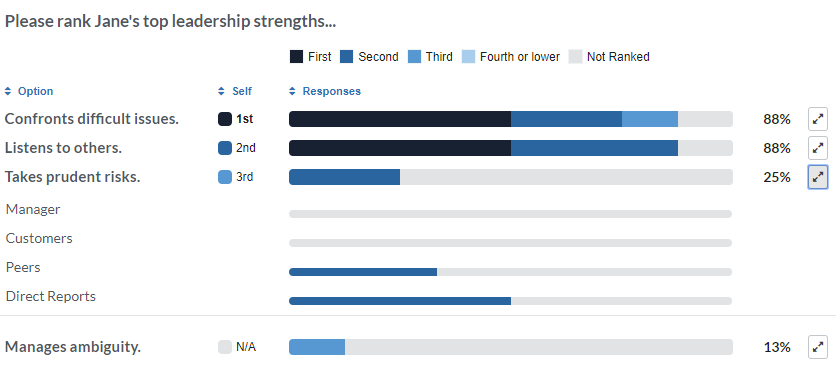
Grouped Feedback: If you're using ‘grouped feedback’ (also called “360 feedback”), you can compare perceptions across the feedback groups. For example, Jane’s own self-assessment was consistent with her feedback providers, but her direct reports and peers rated her more favorably on risk-taking than her manager or customers did.
Feedback Analytics
- Feedback Analytics, which displays aggregate data for everyone who received Feedback in a given cycle, works just like the Individual Feedback report, except with a few additional superpowers.
- Filtering: you can filter your results by any demographic or by date range.
- Slicing: you can slice your results by Demographics or Participant. Note: When slicing, you'll lose the ability to look at the results by Feedback Group.