View Turnover Trends for Voluntarily Terminated Employees Only
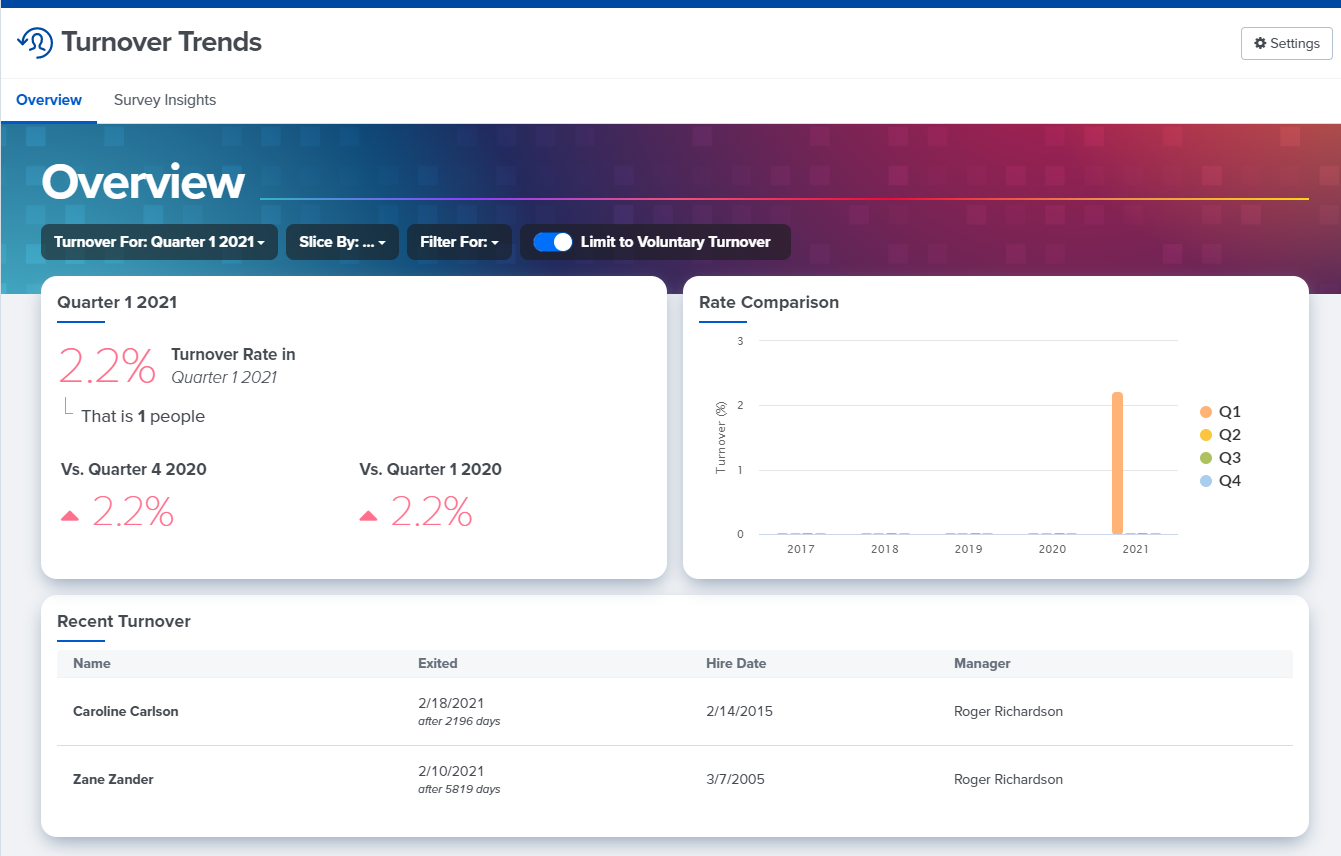
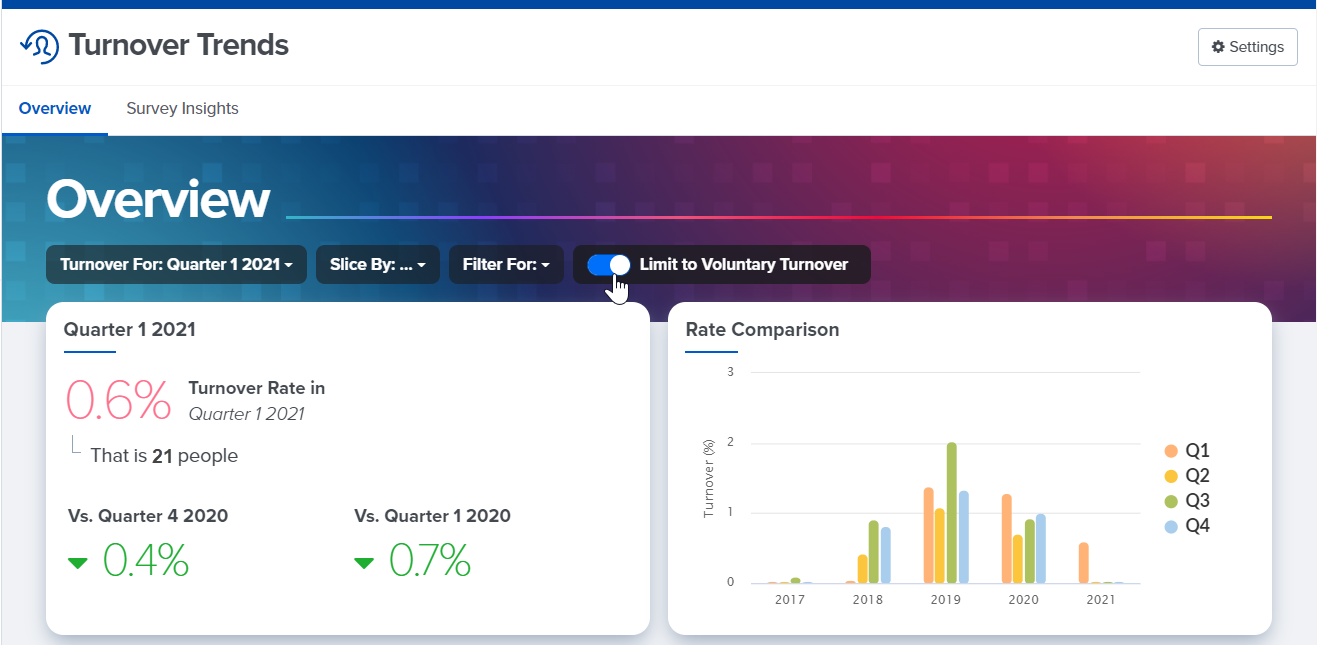
Within Turnover Trends, you can now view turnover data for your voluntarily terminated employees only. This allows you to focus on your regrettable turnover and examine how survey responses from your voluntarily terminated employees compare to responses from your current employees.
The next time you access Turnover Trends, you will be prompted to confirm which demographic values within your account correspond to “Voluntary” and “Involuntary” terminations. Then, going forward, you and your colleagues will be able to toggle between viewing data for voluntarily terminated employees only or for all terminated employees.
Compare Survey Results (and 1-on-1s and Feedback Analytics) by Generation
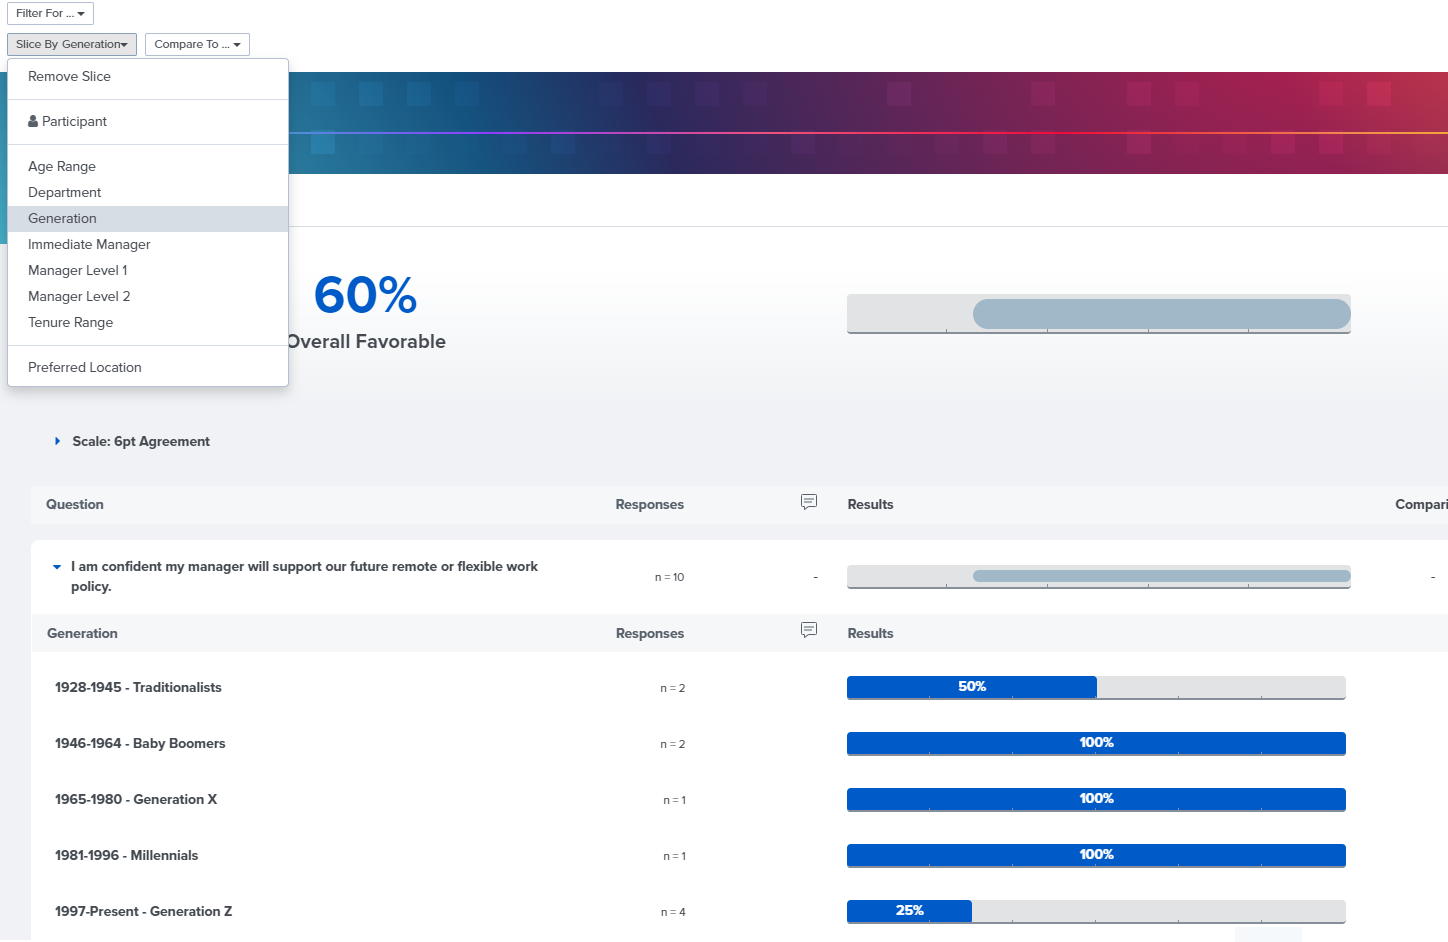
If you include the birth date of your employees in Quantum Workplace, you will now be able to slice and filter your Surveys, Feedback, and 1-on-1s Analytics by generation to see how results differ between your organization’s Gen X, Millennial, Gen Z, and Baby Boomer populations. The generation demographic will be automatically added to every survey, Feedback, or 1-on-1s cycle that you launch going forward.
By default, Admin users will be able to slice and filter their analytics by generation. Admins can give managers the ability to slice and filter their downline analytics data by generation from the Demographics tab in General Settings:
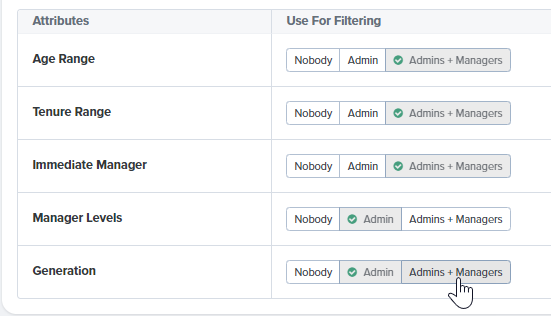
Quantum Workplace uses the Pew Research Center guidelines to group employees into generation. You can view our birth year cutoffs here.
View Goals by Goal Owner in Analytics

Goals Analytics provides Admin users with visibility into goals activity throughout the organization. For every employee in your organization you will now be able to see a separate count of the number of goals that they own and contribute to, so that you can see at a glance how many goals each employee owns.
The main dashboard in Goals Analytics includes a row for every employee in your company and displays the number of goals that they both own and contribute to for each Goal Type.
You can also download the Excel export to view the current progress on goals throughout your organization. For every employee in your organization, the Excel export will list every goal that they're associated with as either an owner or a contributor and will specify whether they own or contribute to the goal. Learn more about Goals Analytics here.
Noteworthy Improvement
Easily Add and View Attachments in 1-on-1s
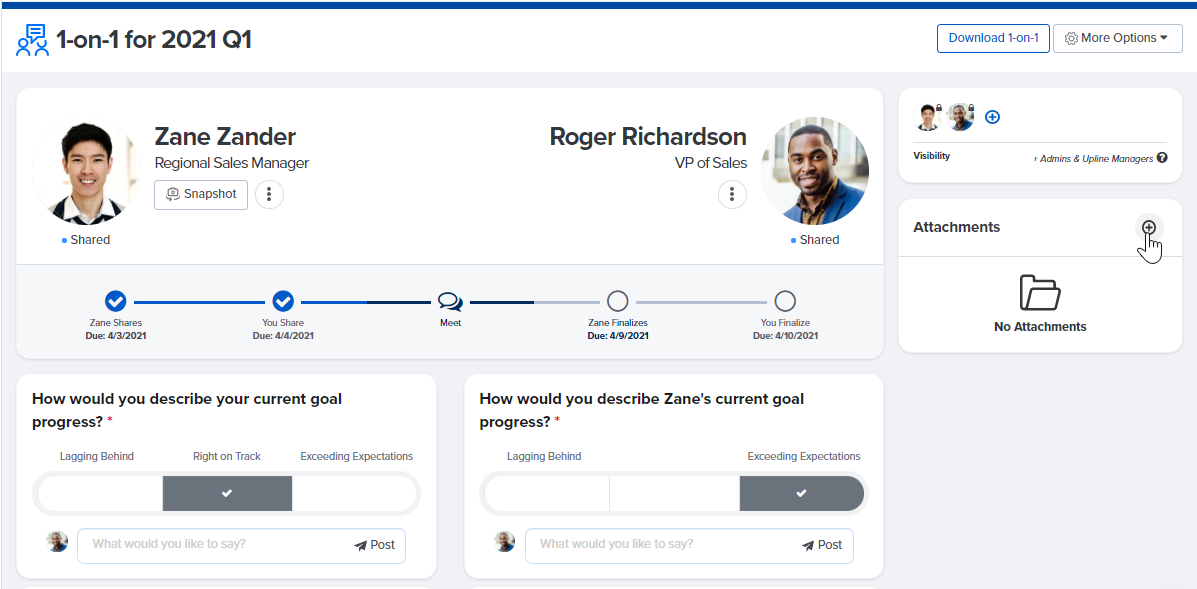
In order to make attachments within 1-on-1s easier to view and to add, the Add Attachments function has been moved from the bottom of the 1-on-1 to the right hand side. Going forward, users can both upload and view all attachments within a 1-on-1 from the right side of the screen.
Fixed: Heat Map Export in Excel
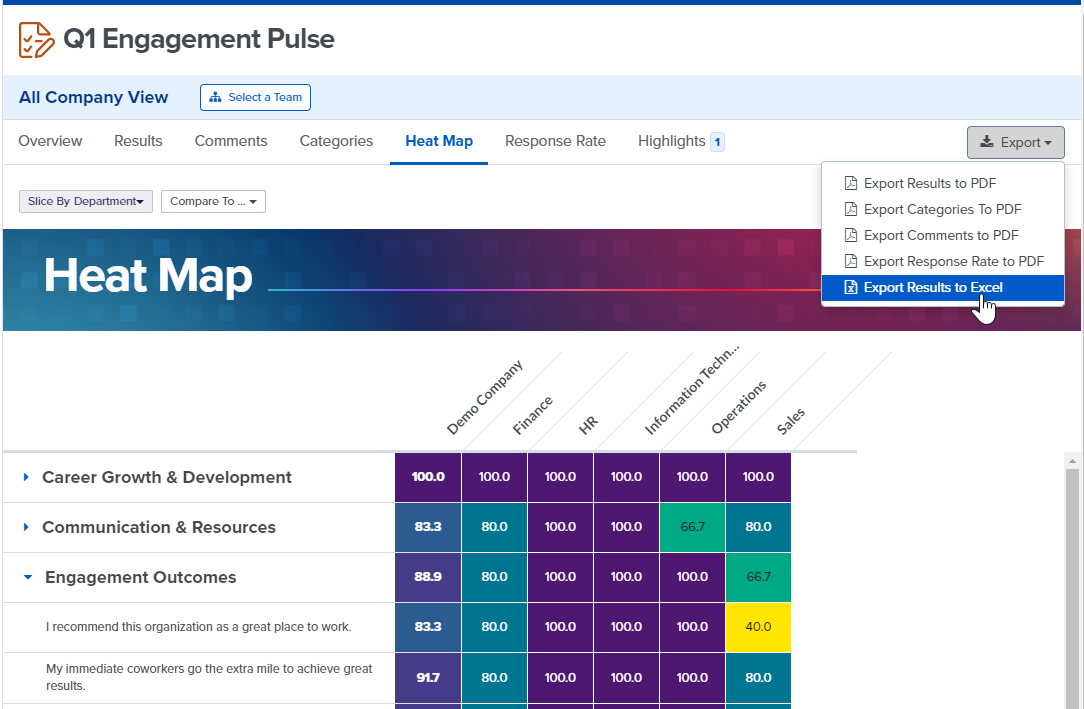
The Heat Map Report in Surveys Analytics reveals how survey results differ between different demographic groups in your organization such as department, position level, or tenure.
Previously, all items on a survey had to be assigned to a category (e.g. Communication & Resources) in order to download the Heat Map into Excel. This is now fixed so that the Heat Map Excel export will generate regardless of whether survey items are categorized.
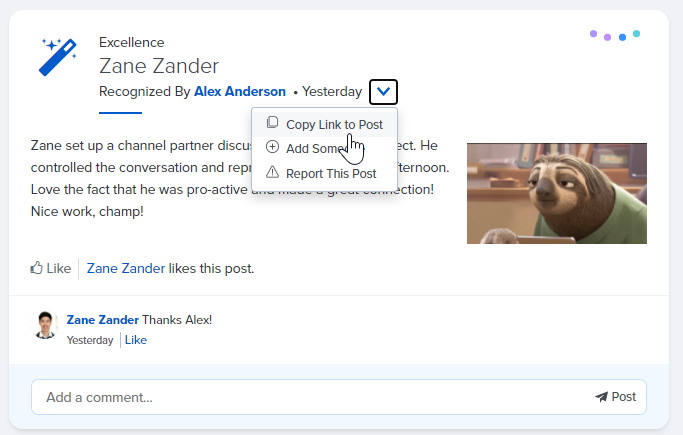
Fixed: Copy Post Link in Recognition
The ability to copy a link to a Recognition has been restored: